On Thursday, 5 November, the S&P 500 lost 4.4% in one day, its worst day since April 2025. The Nasdaq-100 lost more than 6%. Nvidia lost 9%. The selling came from the same place the gains came from for three years: AI.
So here is our stand, in plain words. We think AI is a bubble. Not the technology. The price.
What makes it a bubble?
Start with the price. From its October 2022 low to its record close on 6 Oct 2026, Nvidia rose 2,039%. A company that size does not grow its profits that fast for long. The price assumed it would.
Then look at where the money comes from. Big tech now funds data centres partly off its own balance sheet, through private credit and other lenders that sit outside normal bank rules. Regulators have started to say it out loud: the Financial Stability Board on private credit, and the Bank for International Settlements on AI money flowing through what is often called shadow banking. Chip makers and cloud firms take stakes in AI start-ups, and the start-ups spend that money on the same chips and cloud. Demand that is partly paid for by the seller is not the same as demand.
And look at the crowd. Last week silver crashed and everyone wanted out of metals and into AI. That is usually how it feels at the top of one trade and the bottom of another.
Has Nvidia crashed before?
Yes, and not once. The chart shows Nvidia measured from its best close so far, every trading day since 1999. Zero means a new record. Everything below is how far it was under water.
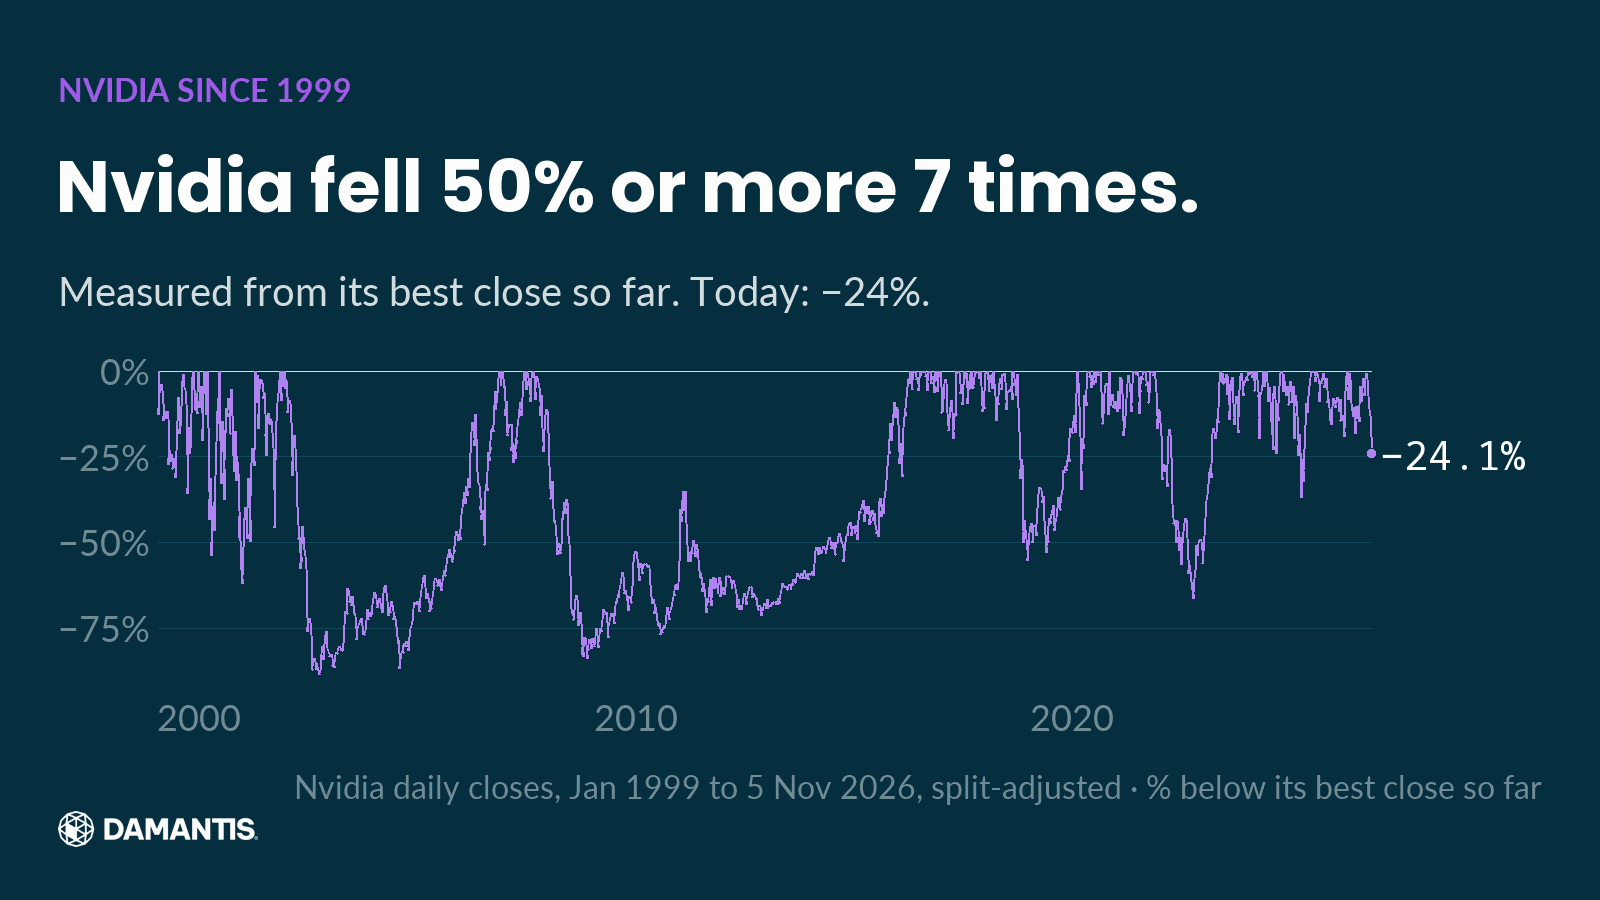
Nvidia fell 50% or more 7 times in that span. Into 2002 it lost 90%. In 2008 it lost 85%. In 2022, two years into the last tech boom, it lost 66%. Today it is 24% below the October record.
Everyone who owns Nvidia today knows the last part of that chart. Almost nobody remembers the first half.
What happened to the Nvidia of 2000?
In 2000 the story was the internet, and the company selling the shovels was Cisco. Its routers ran the web the way Nvidia's chips run AI today. For a few weeks in March 2000 it was the most valuable company in the world.
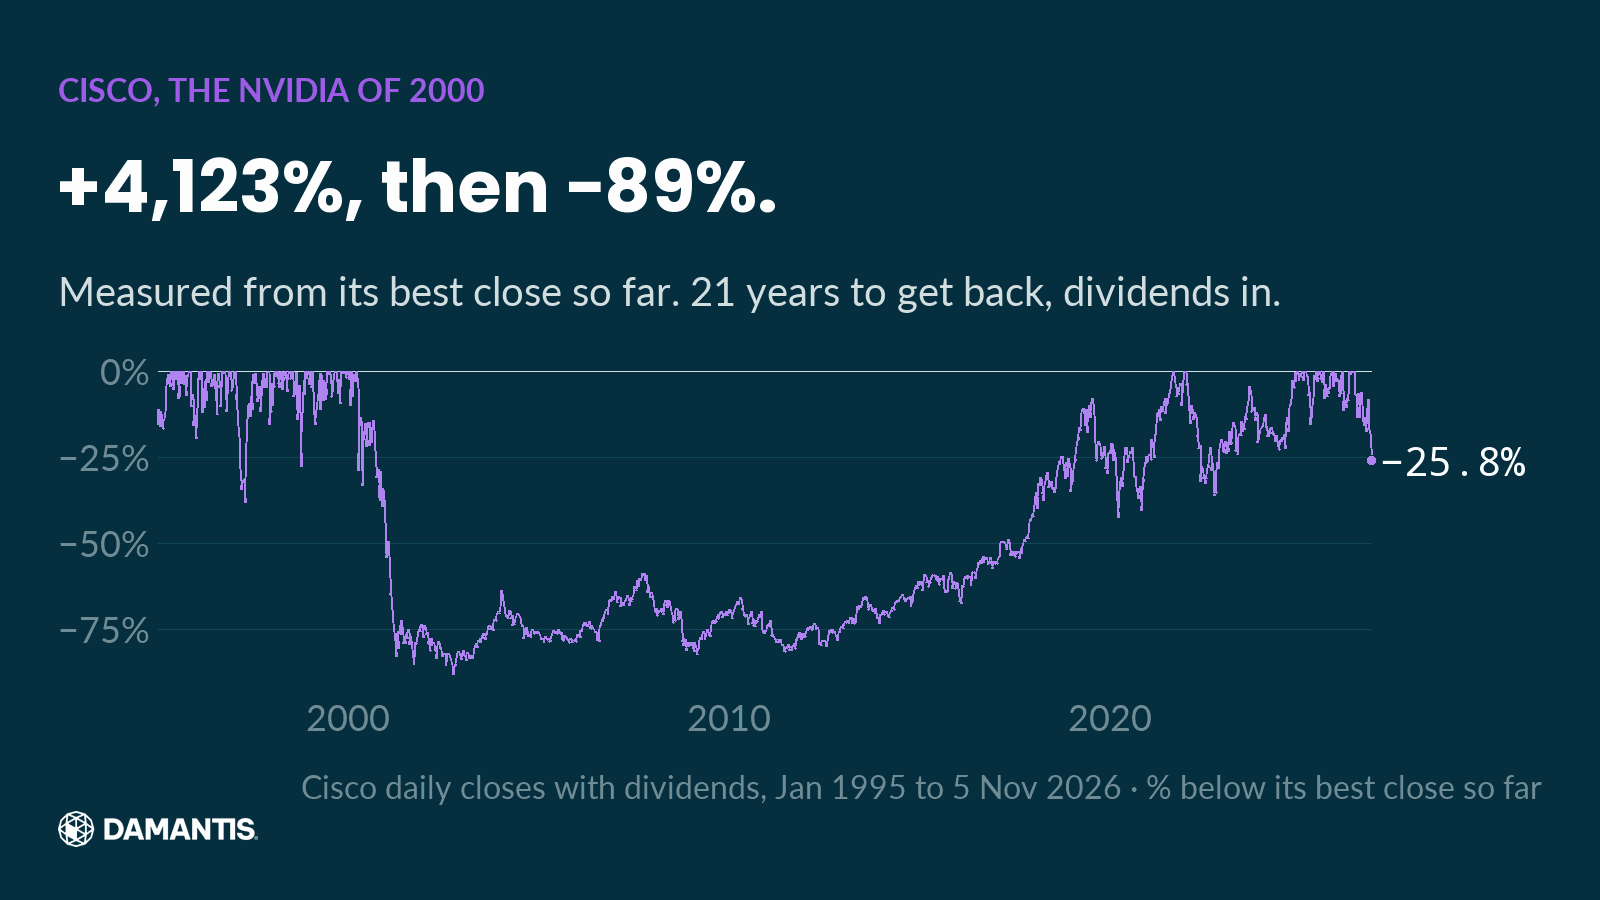
From the start of 1995 to its peak in March 2000, Cisco rose 4,123%. Then it lost 89%. The internet did not go away. Cisco kept selling routers and kept making money. The price had simply run years ahead of the business, and it took 21 years, with every dividend reinvested, to get back to the March 2000 close. The Nasdaq-100 as a whole fell 83% and needed 15 years.
That is the point. A bubble does not need the technology to be wrong. It only needs the price to be wrong.
Could this pull everything else down?
That is the part that worries us most. When a handful of AI names make up a large part of the big indexes, a fund that tracks the S&P 500 is quietly an AI fund. And when lenders outside the banking system finance the build-out, losses can show up in places nobody was watching.
It does not take a big country for that to hurt. This week Paraguay's Ueno Bank was put into resolution. It served about six in ten adults in the country, and millions of people could not reach their savings. That bank had nothing to do with AI. It is a reminder of how fast money that looks safe can be locked away.
Where do we stand?
We think AI is a bubble. We think the crowd sold gold and silver at the wrong moment to chase it, and we are bullish on silver and gold. You can read the other side of that stand in silver was this oversold 10 times since 1996.
None of this tells anyone what to do with their own money. It is our view, with the data next to it, so you can check it. Screenshot this.
Frequently asked questions
How many times has Nvidia fallen 50% or more?
Since 1999, Nvidia fell 50% or more from its best close 7 times, counting each fall once until a new record. The deepest was 90% into 2002, then 85% in 2008 and 66% in 2022.
How far is Nvidia below its record now?
Nvidia closed 24% below its record close of 6 Oct 2026.
What happened to Cisco after the dot-com bubble?
Cisco rose 4,123% from the start of 1995 to its March 2000 peak, then fell 89% by October 2002. With dividends reinvested it took 21 years to get back to that peak. Its share price alone took longer.
Is the AI technology itself a bubble?
We do not think so. The internet was real in 2000 and the price still fell 89%. Our stand is about the price of AI stocks, not the technology.
How damantis looks at this
Every chart in this article was computed from market data, with its source and date on the image. No figure was typed in by hand. damantis applies the same discipline to its signals and model portfolio: risk first, data over narrative. See how it works at damantis.com.
Education, not investment advice.