Most market charts answer one question: is it up or down? We find the other questions more interesting. How long does an asset spend below its last high? Which days actually did the damage? How have stocks done against gold, rather than against the dollar? And is the asset with the wild reputation really the wild one?
This week we built five charts around those questions. Every number in this piece comes from daily closing prices, and none of them is a forecast.
1. Gold, measured from its last record
Gold charts usually show the price. We wanted to see something else: on any given day, how far was gold from the best close it had ever had up to that point? Zero on this chart means a new record. Anything below zero is time spent waiting.
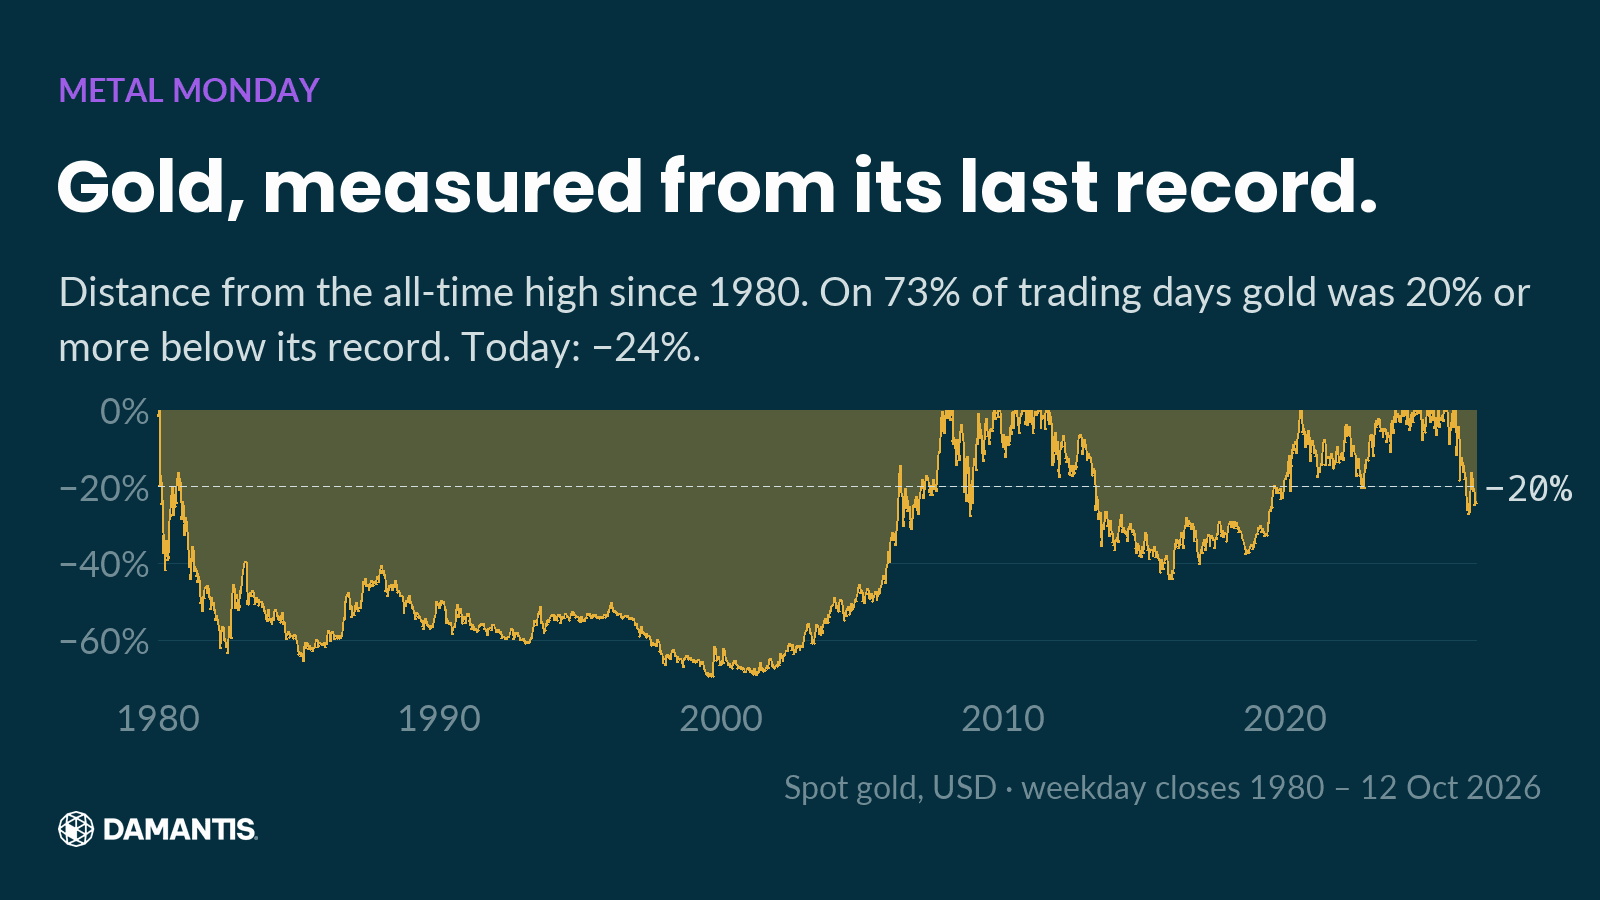
The answer surprised us. Since 1 Jan 1980, gold closed 20% or more below its running record on 73% of all trading days. The low point came on 25 Aug 1999, when gold stood −70% from its peak. On 12 Oct 2026 it stood −24.3% from its latest record close.
Look at the long valley on the left. That isn't a dip. The 1980 high stayed out of reach until the late 2000s, and the shorter valleys since then were still deep enough to test anyone's patience.
Records make the news, but they only last a day. Most of the time, someone holding gold is sitting somewhere below a high. Before looking at any price chart, it helps to ask yourself how far below a peak you could comfortably sit, and for how long.
2. Five days did the damage
On a normal price chart, gold's fall since its record close on 28 Jan 2026 looks like a slow, steady slide. When we split it into individual days, it looked completely different.
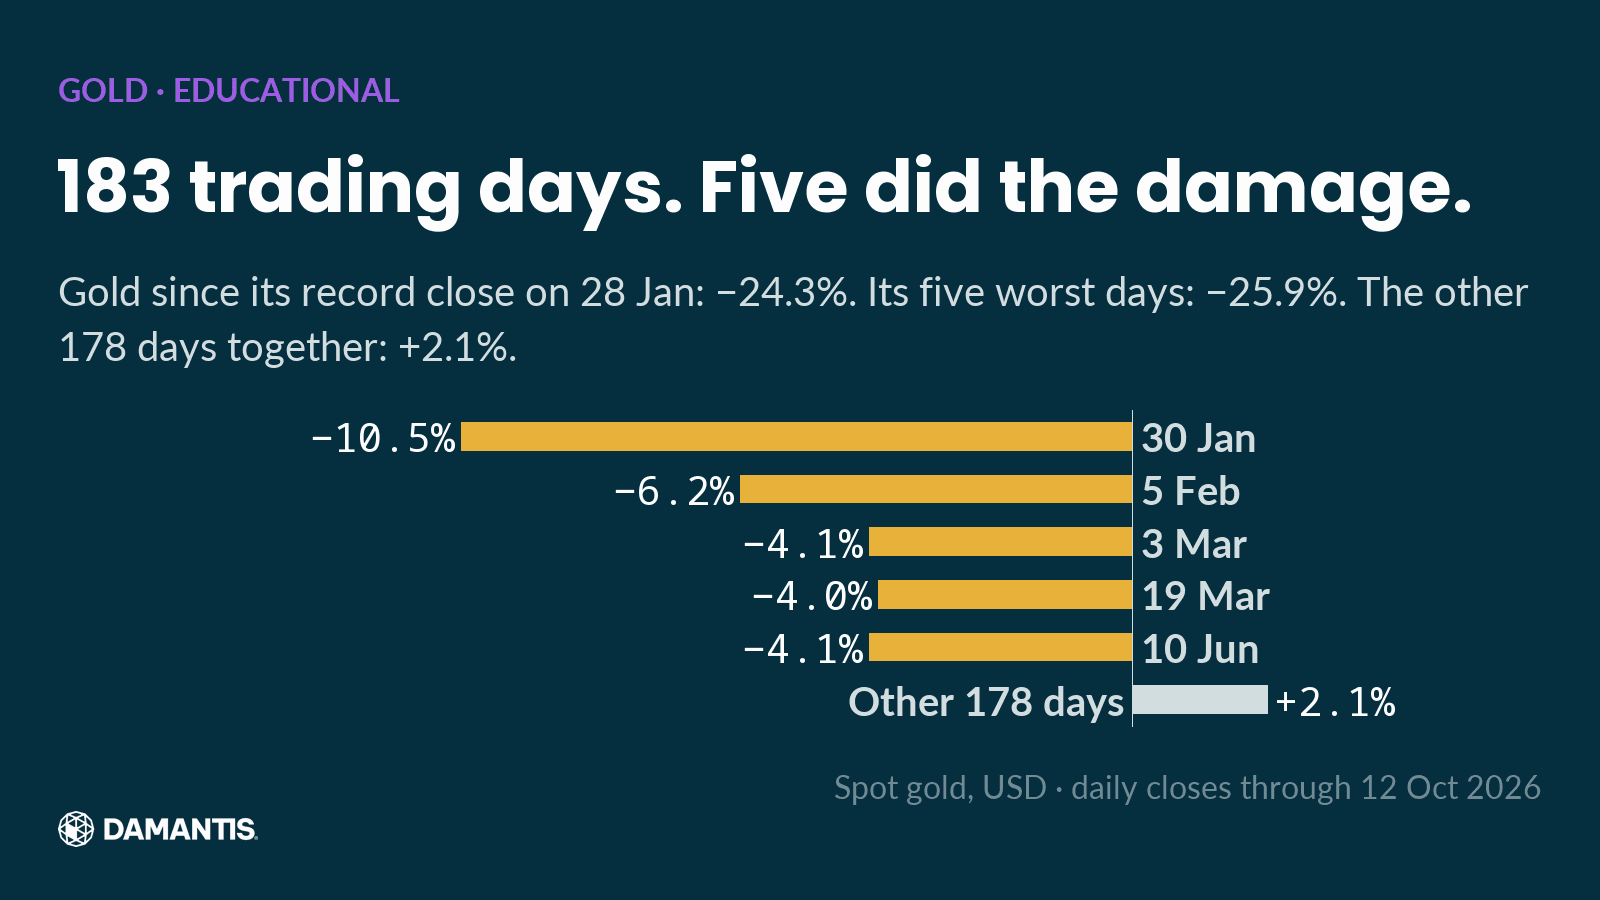
From that record close to 12 Oct 2026, gold's return was −24.3%. Its five weakest days alone added up to −25.9%. The other 178 trading days, taken together, came to +2.1%. Take out those five sessions and gold would be above its January record today.
So the decline wasn't really a slide. It was a handful of very bad days with a lot of quiet in between. That matters, because the two feel completely different when you live through them. A slow slide gives you time to notice. A few sharp days don't. If you only check the year-to-date number, you see where gold ended up, but not how it got there.
3. The S&P 500, measured against gold
The S&P 500 has closed at new records several times this year. Measured in dollars, the long-run chart goes up and to the right. We wanted to compare it against gold instead, so we divided the index level by the gold price. The chart shows how many ounces of gold one unit of the S&P 500 was worth on each day.
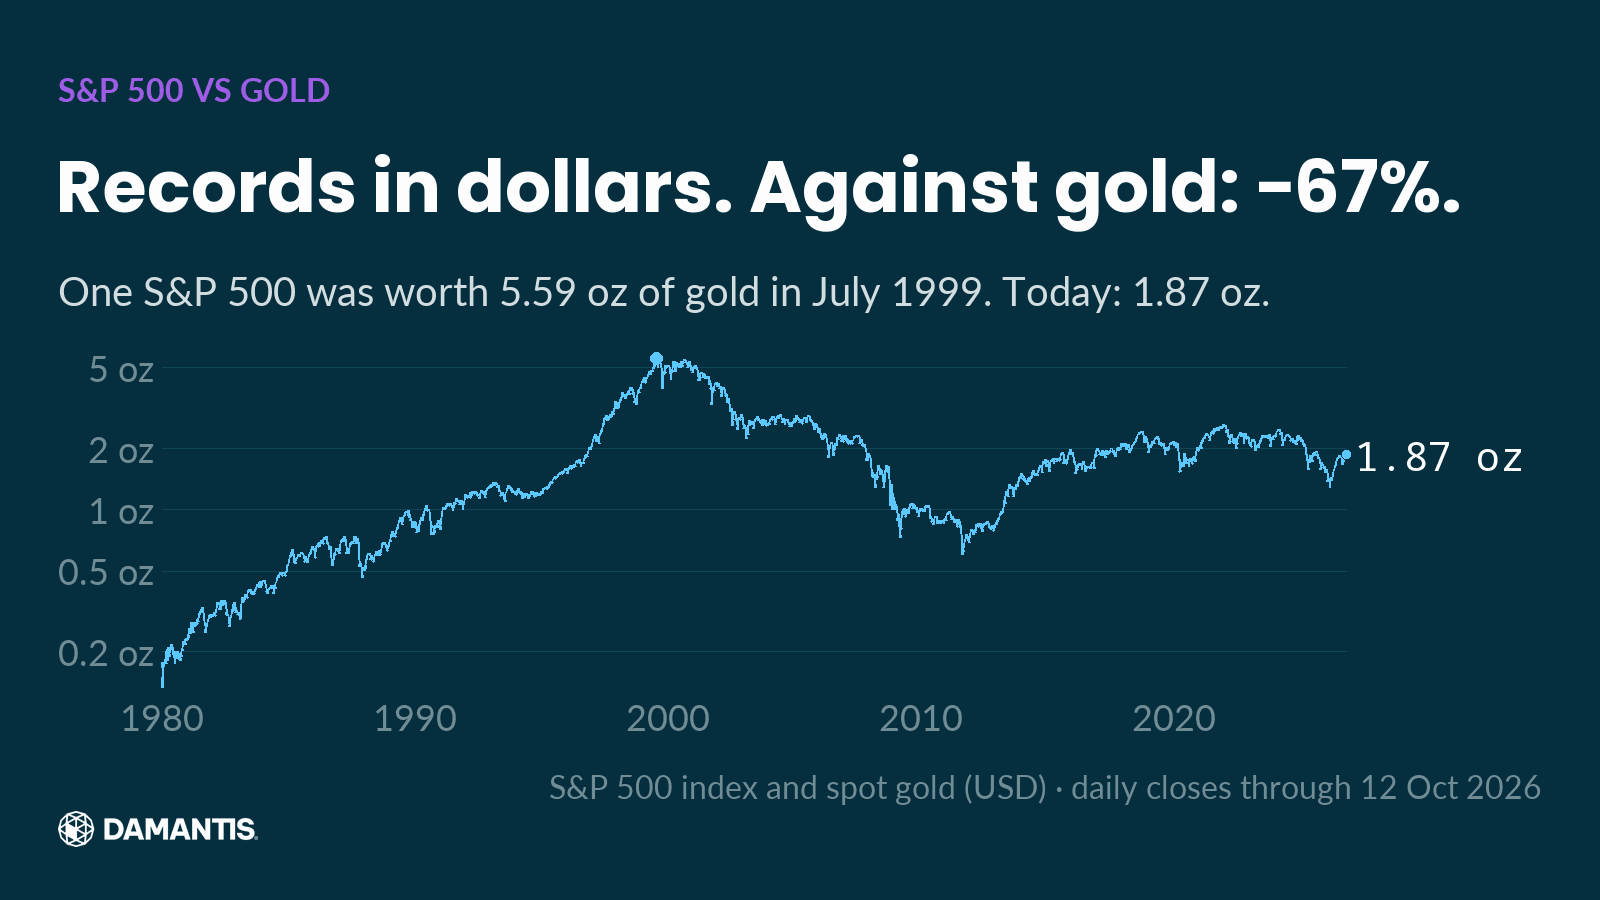
At the peak in July 1999, one unit of the S&P 500 was worth 5.59 ounces of gold. On 12 Oct 2026 it was worth 1.87 ounces, −67% from that peak. Back in January 1980, it was worth just 0.13 ounces.
This doesn't mean gold is the better asset, or the worse one. It's a comparison of two assets, and it shows something the dollar chart hides: for long stretches, stocks and gold took turns. Stocks pulled far ahead into July 1999. Then gold pulled ahead, and stocks have won back only part of that ground since.
It also shows how much the starting point matters. A comparison that begins at a low and ends at a high tells a very different story from one that covers the whole cycle. This one runs from 2 Jan 1980 to 12 Oct 2026. Next time you see a long-run comparison, check the start date and the end date first.
4. Myth: Bitcoin is the wild one
Everyone knows Bitcoin is volatile. Silver, on the other hand, has a reputation as the sleepy cousin of gold. So we counted. On the same 195 trading days in 2026, how often did each asset move 5% or more in a single day, up or down?
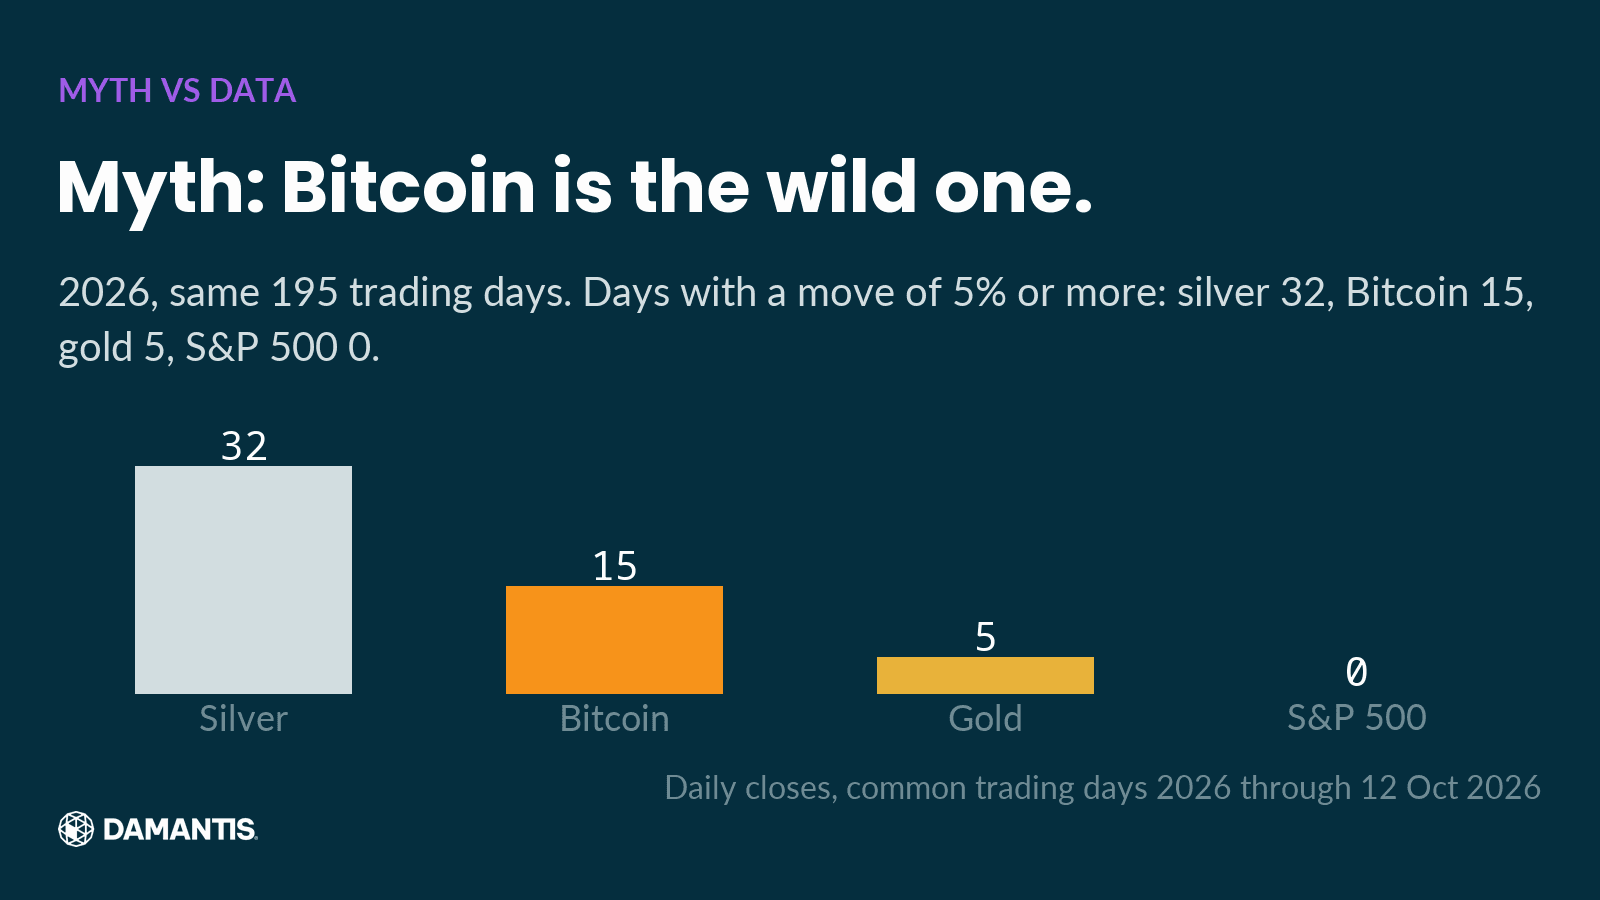
Silver: 32 days. Bitcoin: 15. Gold: 5. The S&P 500: 0.
Silver moved sharply more often than Bitcoin this year. We think that says something about how risk gets perceived. When everyone expects an asset to swing, its swings don't surprise anyone. When an asset is supposed to be calm, it can move just as hard without getting the same attention.
The rule we used is simple and the same for all four assets: a close 5% or more away from the previous close, in either direction. Reputations get built over years and repeated in headlines. Counting takes an afternoon.
5. Patience as a position
The last chart goes back to January 1980, when gold set a closing high that would stand for a very long time.
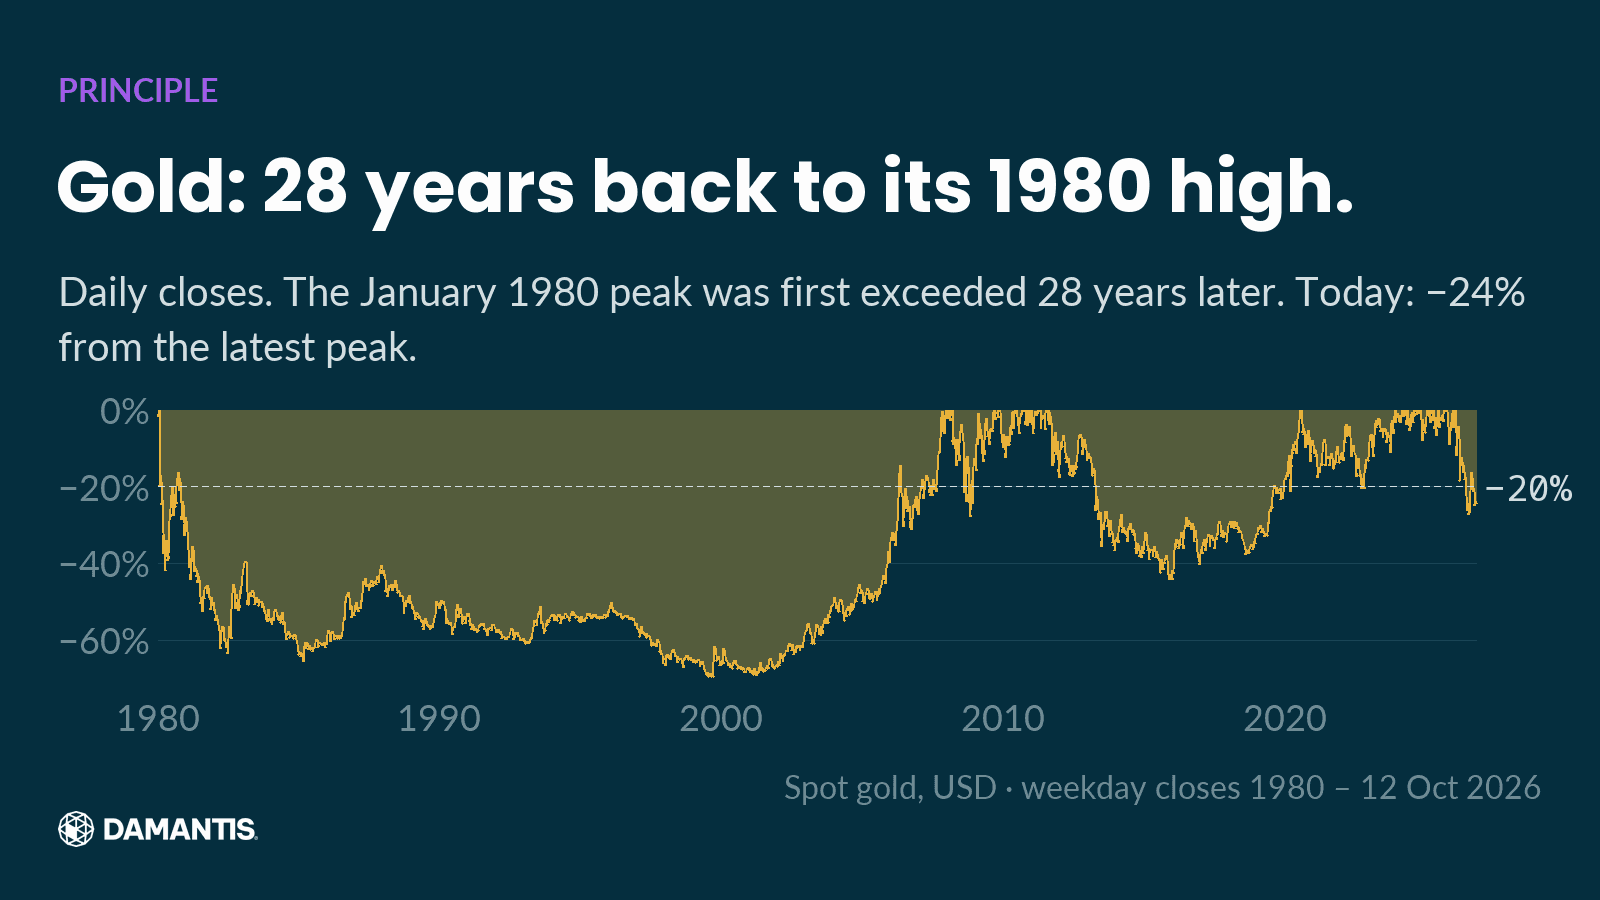
As the chart shows, it took almost three decades before gold closed above that level again. Anyone who started at the 1980 peak needed far more patience than most plans allow for. We don't read that as a verdict on gold. It's a reminder that recovery time is part of risk, and it's almost never shown next to the return.
How we built these charts
A chart is only as honest as the choices behind it, so here are ours.
All prices are daily closing prices from a commercial market data provider. Gold and silver are spot prices in US dollars, and for them we only use weekday closes, because thin weekend quotes would distort the picture. Bitcoin trades every day, so its count uses only the days on which all four assets traded. The S&P 500 is the index level itself, not a fund that tracks it.
Each chart shows its source and the last day of data on the image. We don't type the numbers in this text by hand. They're computed from the same data as the chart next to them, and the article is only built if every number passes the same checks as our social posts. Those checks look for gaps in the data, implausible daily moves, a single as-of date per chart, and a second source for record claims where one exists. For gold we rely on these daily closes alone, which is why the record and recovery claims above say "daily closes". The official London fixing is a different price type and can differ from a closing price.
When a single day looks extreme, we confirm it against a second source before it goes into a chart. If we can't confirm it, the chart doesn't get built.
What the five charts have in common
Each one takes a story you've probably heard and puts a number on it:
- "Gold is a safe store of value": it spent most of the time since 1980 well below its last record.
- "Gold is down a bit this year": five days explain more than the whole decline.
- "Stocks keep hitting records": measured against gold, the S&P 500 still stands −67% from its July 1999 peak.
- "Bitcoin is the volatile one": silver had more big days in 2026.
- "It always comes back": sometimes it takes a generation.
None of these charts tells you what to do next. They show what happened, measured on closing prices, with the date on every image. If there's one habit we'd take from them, it's this: look at the risk side of a chart before the return side, and check which period, which comparison and which days a claim rests on.
How damantis looks at this
Every chart in this article was computed from market data, with its source and date on the image. No figure was typed in by hand. damantis applies the same discipline to its signals and model portfolio: risk first, data over narrative. See how it works at damantis.com.
Education, not investment advice.