You remember January. Silver at 121.58 dollars an ounce, gold above 5,596. It felt like the start of something. You may even have bought some.
This weekend we looked at what happened next. Five charts, every number computed from the data, none of them a forecast.
1. The record
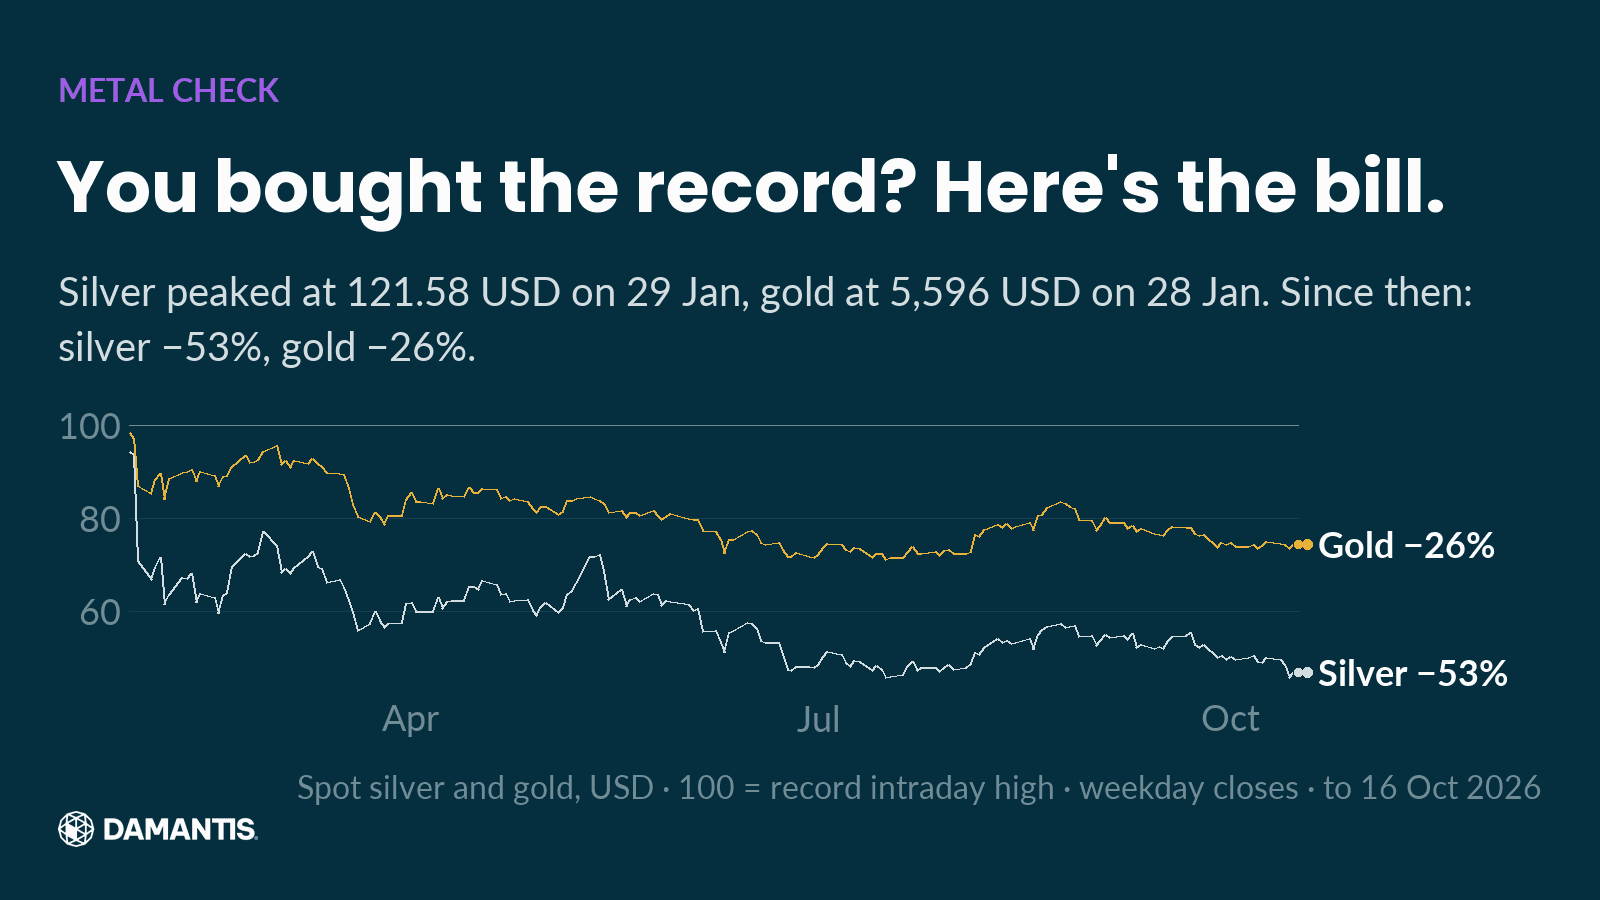
Silver set its record high of 121.58 USD on 29 Jan. On 16 Oct 2026 it stood at −53% from that high. Gold peaked at 5,596 USD on 28 Jan and is −26% since.
Same metals story, two very different bills. Silver fell about twice as far as gold. If you thought of silver as gold's cheaper twin, this chart is the correction: it moves with gold, but harder, in both directions.
2. This week
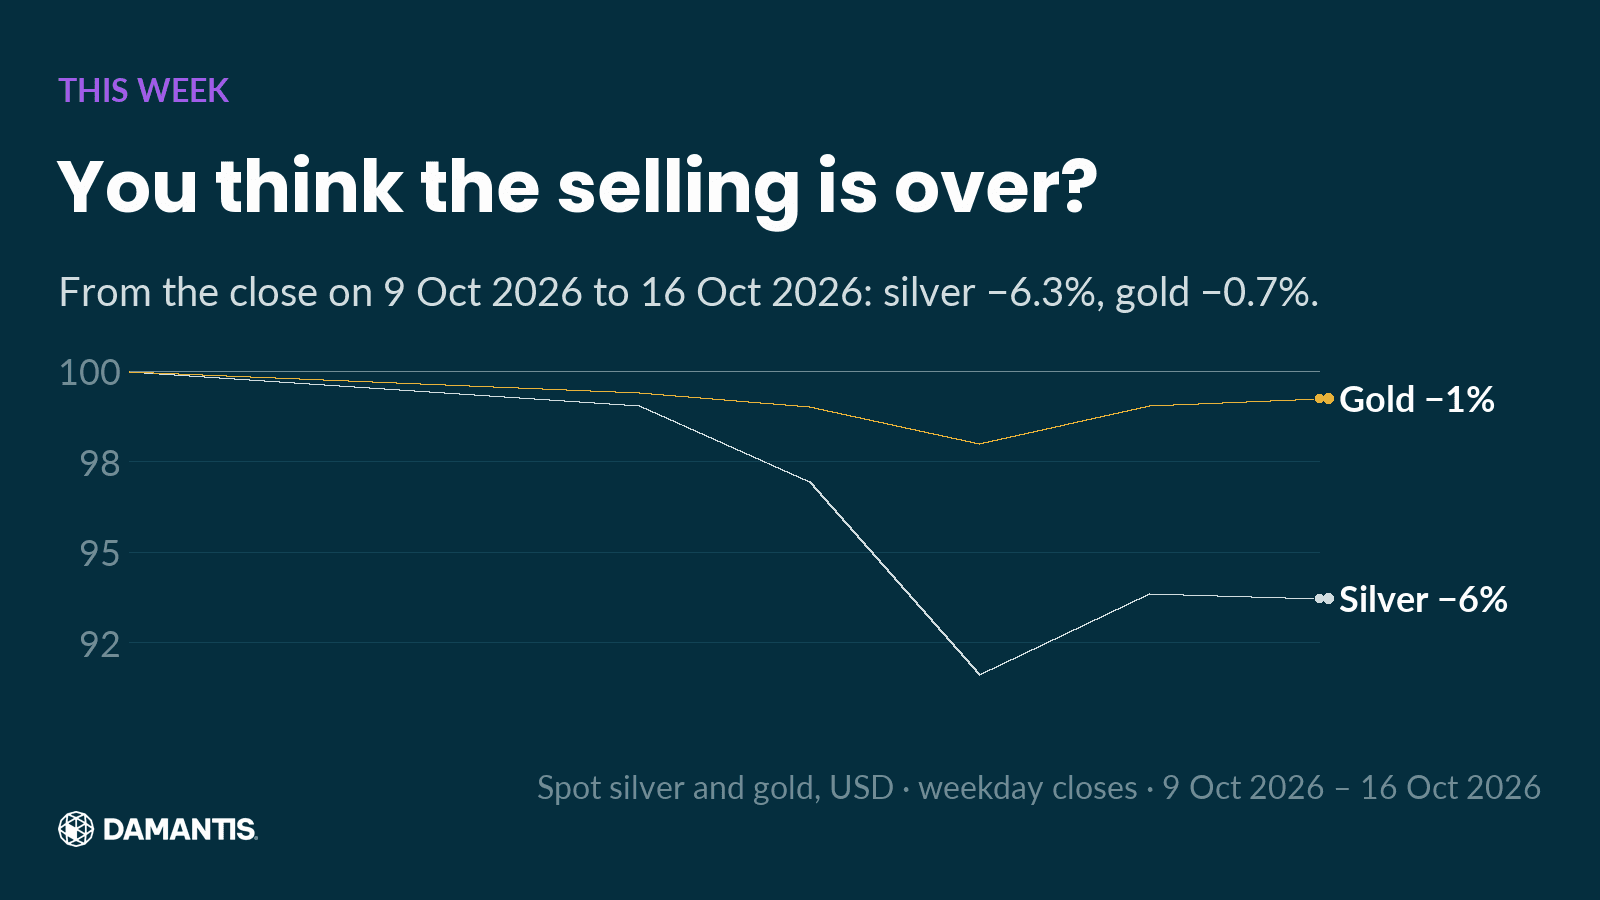
From the close on 9 Oct 2026 to 16 Oct 2026, silver moved −6.3% and gold −0.7%. You thought the selling was over? Silver took the hit this week; gold barely moved. Nine months after the record, silver still swings like this.
3. The wild one
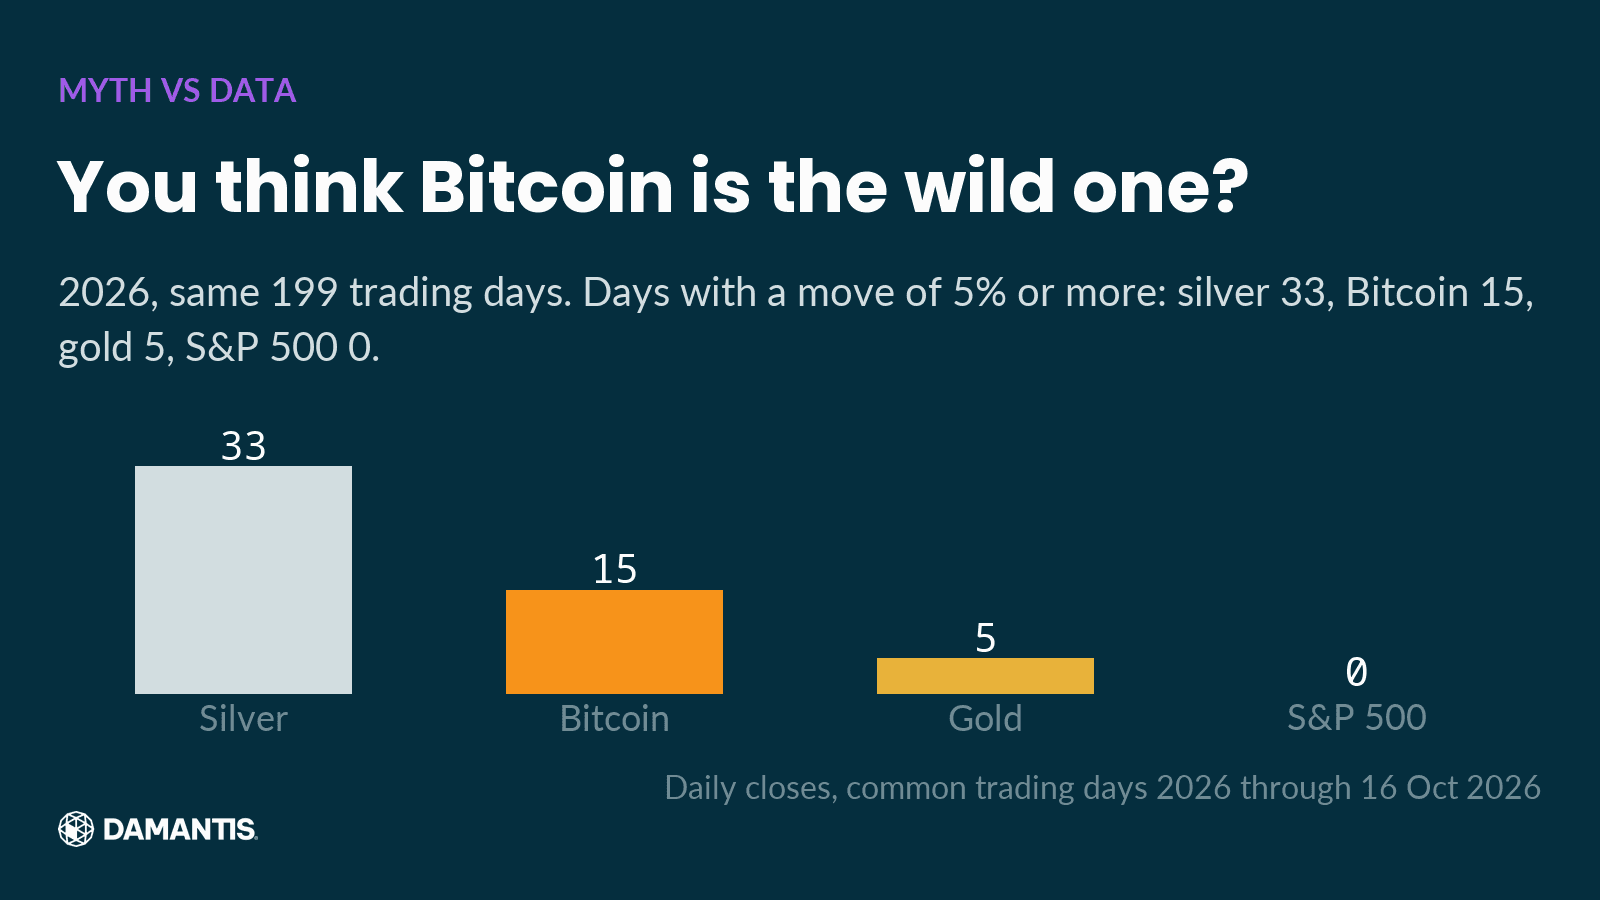
We counted every day in 2026 on which an asset closed 5% or more away from the day before, up or down. Same 199 trading days for all four. Silver: 33 days. Bitcoin: 15. Gold: 5. The S&P 500: 0.
Silver has the reputation of the sleepy metal. This year it moved hard more often than Bitcoin. Nobody expects it, so nobody talks about it.
4. The ratio
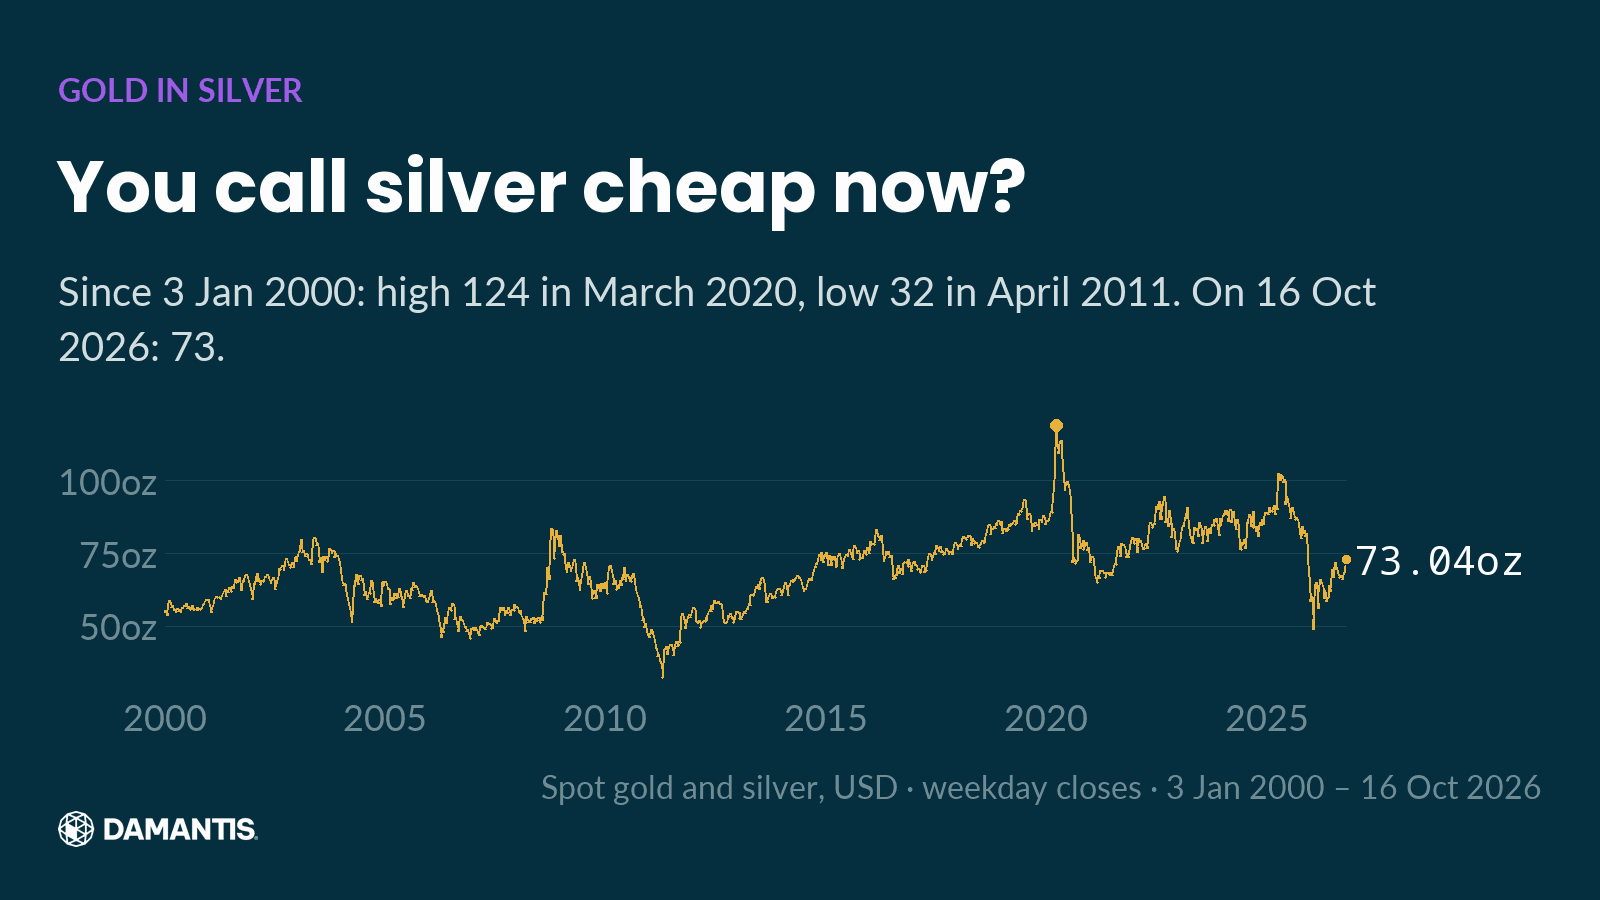
The gold-silver ratio tells you how many ounces of silver one ounce of gold buys. On 16 Oct 2026 it was 73. Since 3 Jan 2000 it has ranged from 32 in April 2011 to 124 in March 2020.
So after this fall, silver is not at an extreme against gold. It sits in the middle of its range. A falling price alone doesn't make something cheap. The ratio is one way to check that against something else.
5. The wait
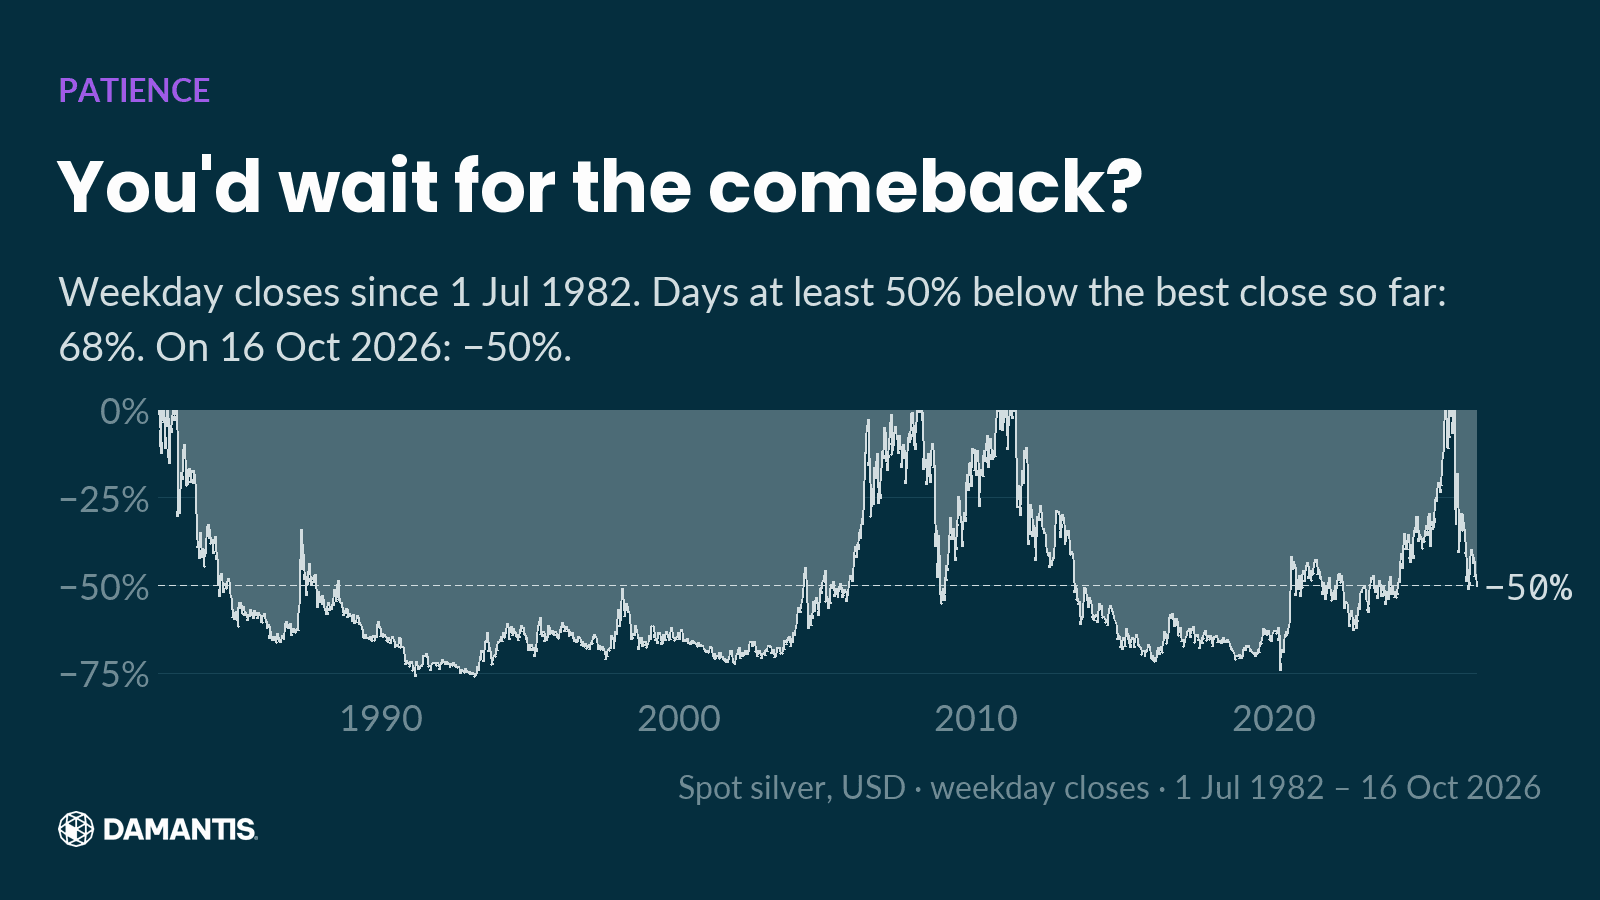
This chart measures silver on every day against its best close up to that day. Since 1 Jul 1982, silver spent 68% of all trading days at least half below its best close so far. The deepest point came on 22 Feb 1991, at −76%. On 16 Oct 2026: −50% from its best close.
Read that again: for most of the last four decades, a silver holder sat at least 50% below the best close they could have had. Recovery time is part of the risk, and it almost never sits next to the return.
How we built these charts
Prices are daily data from a commercial market data provider, spot silver and gold in US dollars, weekday bars only. "Record high" in chart 1 means the highest intraday price, which is why silver's figure there differs from chart 5, which counts from the best close. Bitcoin trades every day, so chart 3 uses only the days on which all four assets traded. Every number in this text is computed from the same data as the chart next to it, and the piece is only built if every number passes the same checks as our social posts.
How damantis looks at this
Every chart in this article was computed from market data, with its source and date on the image. No figure was typed in by hand. damantis applies the same discipline to its signals and model portfolio: risk first, data over narrative. See how it works at damantis.com.
Education, not investment advice.