DAMANTIS Blog
What happens to your 401k in a crash? Every 5 years since 1950
Nov 21, 2026
If the stock market crashes, the stock funds in your 401k fall with it. Since 1950, a fall of 20% or more came in 69% of all five-year spans, and the S&P 500 still ended those five years lower only 16% of the time.
This week the question stopped being theoretical. On Friday 20 Nov the Nasdaq-100 closed at 25,028.98, 5.6% lower on the day and 19.8% below its record close of 6 Oct. It lost 10.4% over the week, which outside reporting called its worst week since 2020. The S&P 500 closed 11.6% below its own record close of 6 Oct, in the 10% to 20% range that is called a correction. Searches for "stock market crash" hit their highest of the week on Friday night.
Ask an AI chatbot about the odds of a crash in the next five years and you get a guess. One says "about half". Another says "near 100%". Neither one counted.
So we counted. Every trading day since 1950 starts a five-year span. That gives 18,085 of them, the last one starting on 12 Nov 2021. For each one we looked at the deepest fall inside it, and at where the S&P 500 stood when the five years were over.
What are the odds of a stock market crash in the next 5 years?
Nobody knows the next five years. What we can count is every five years we already had.
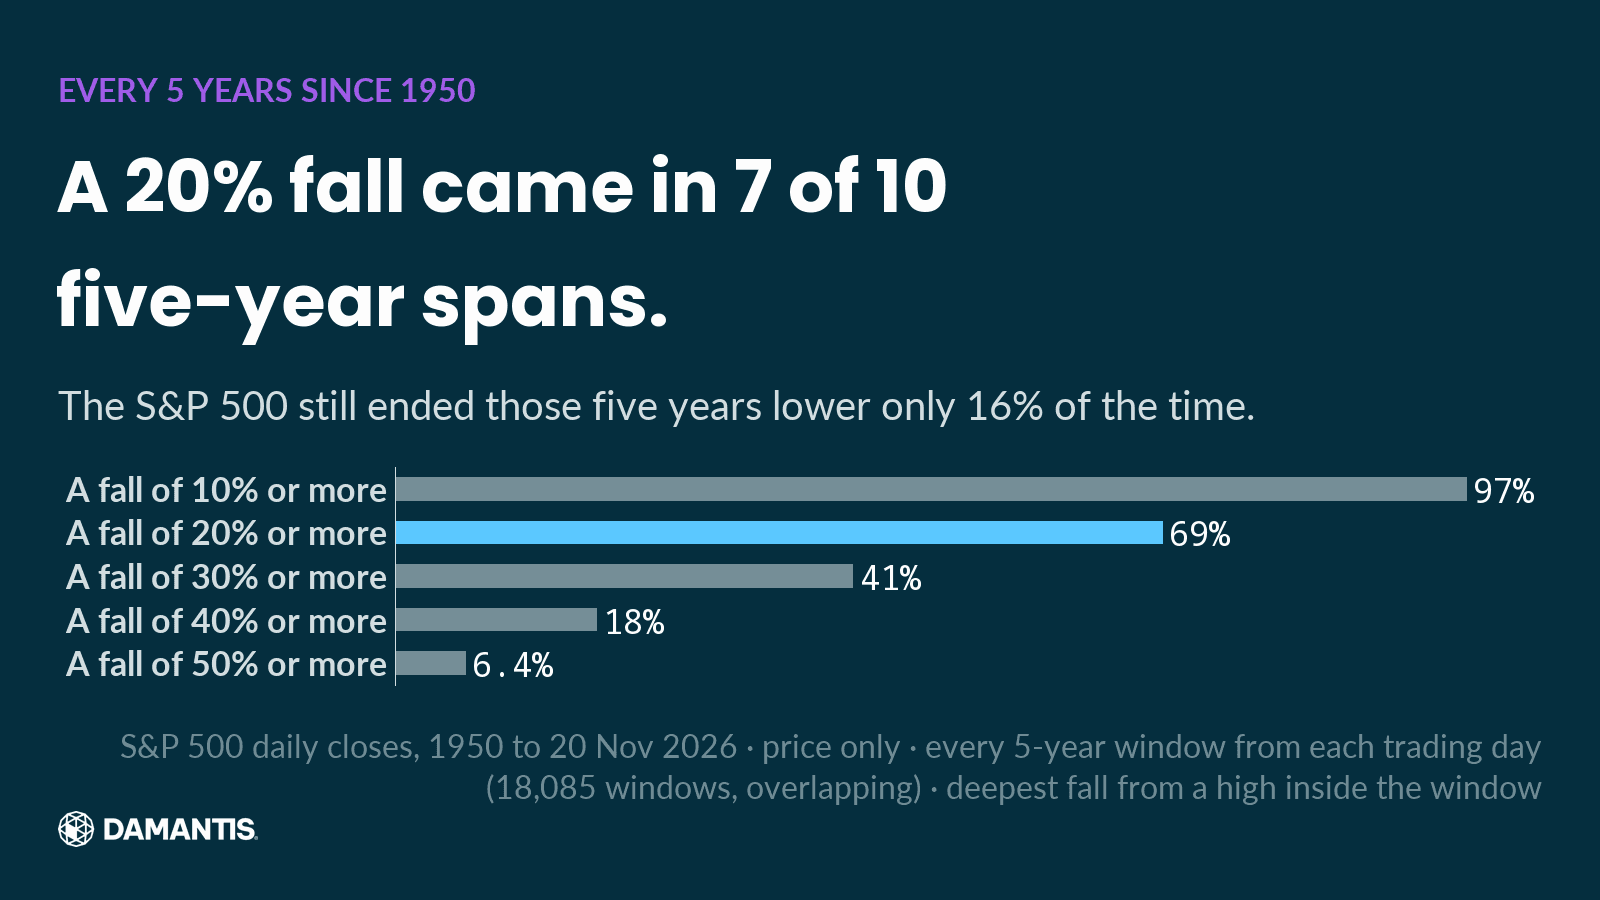
- A fall of 10% or more came in 97% of all five-year spans. It is part of almost every stretch.
- A fall of 20% or more, a bear market, came in 69%. That is about 7 in 10.
- A fall of 30% or more came in 41%.
- A fall of 40% or more came in 18%.
- A fall of 50% or more came in 6%.
Counted from one closing high to the next, the S&P 500 had 11 bear markets since 1950. That is one about every 7 years.
The spans overlap, because every day starts a new one, and the count uses prices without dividends. It describes the past. It is not a forecast.
How often were you still lower after five years?
A crash and a loss are not the same thing. The question is where the money stood when the time was up.
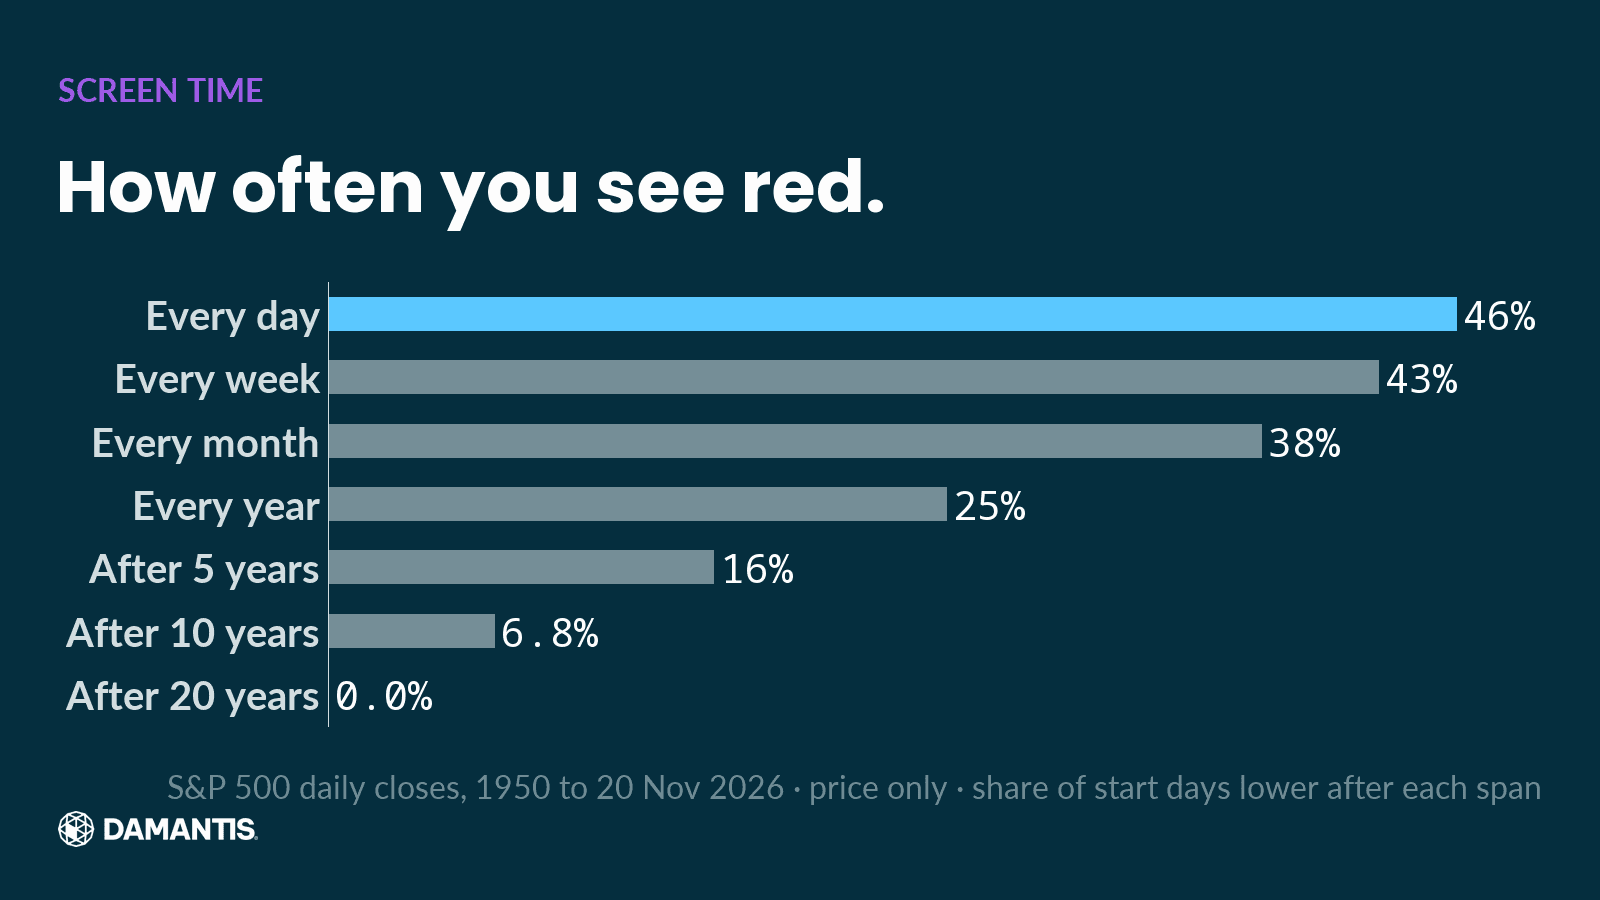
On any single day, the S&P 500 closed lower 46% of the time. After five years it was lower 16% of the time. After ten years it was lower 6.8% of the time. After twenty years it was never lower, not once since 1950.
The harder number sits in between. In 30% of all five-year spans, the money was 20% or more below where it started at some point along the way. In 18% it was 30% or more below. Most of those spans still ended higher. That is the part that is easy to read and hard to live through.
How long did the stock market take to recover from crashes?
Here is every fall of 30% or more since 1927, and the years it took to get back to the old high.
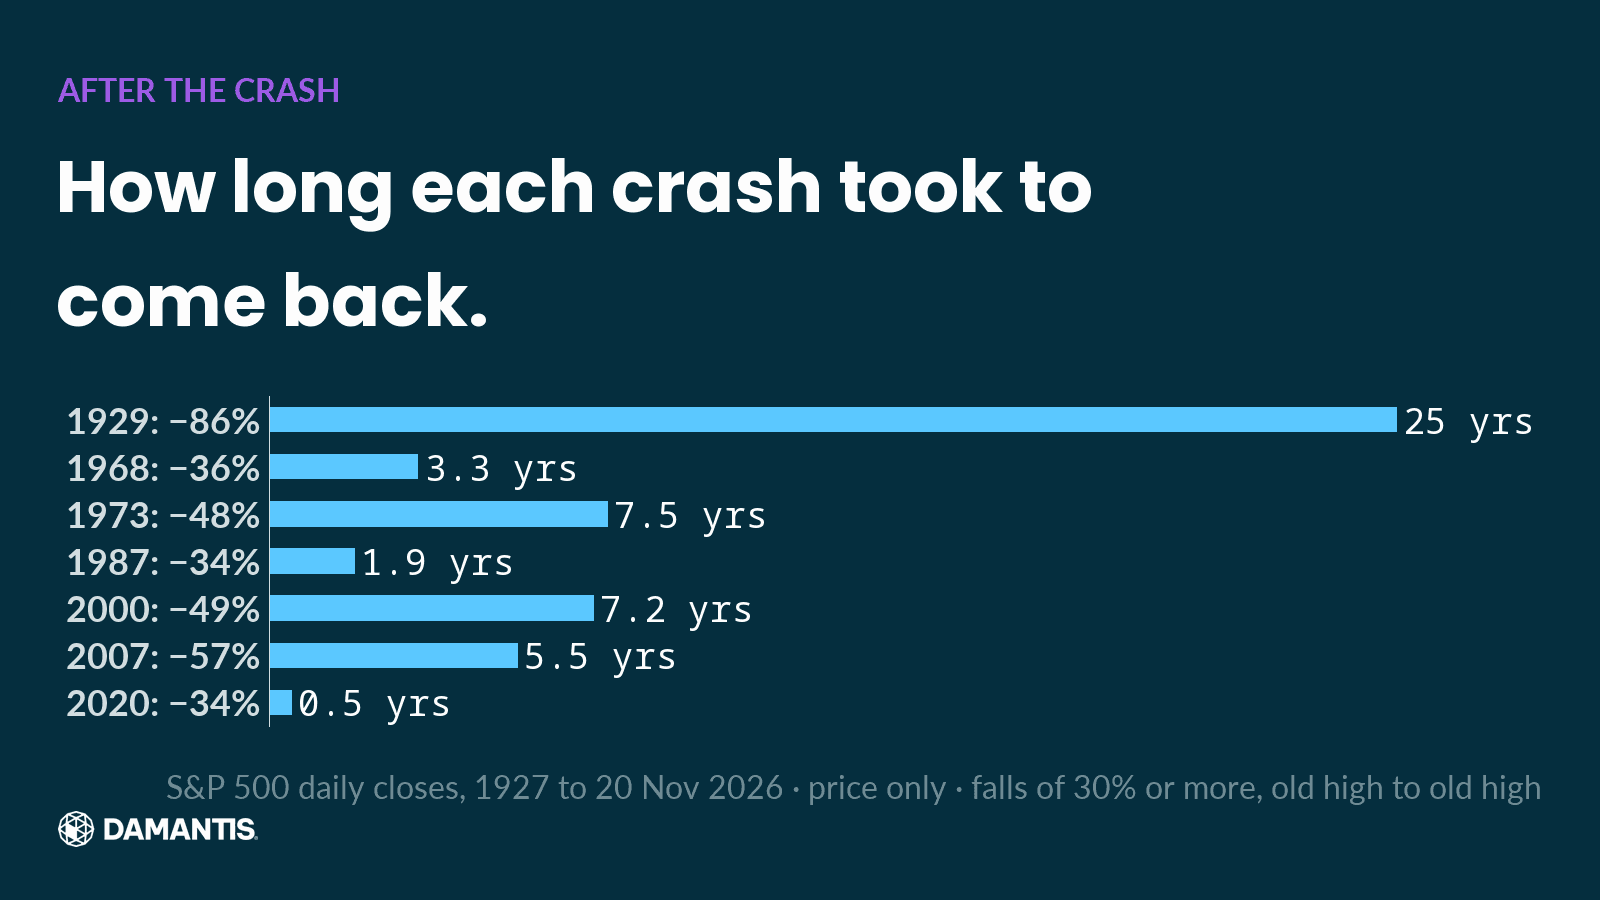
There were 7 of them. The fastest came back in about 6 months, in 2020. The slowest took 25 years, after 1929. The deepest went 86% below the high. These are prices only. With dividends paid back in, every recovery came sooner.
Why does a crash hurt more 5 to 15 years before retirement?
At 35, a crash is a number on a statement. At 58, it can land in the years the money is needed.
The five-year and ten-year numbers above are the time frame that counts for anyone 5 to 15 years from retirement. Over ten years, the S&P 500 ended lower in 6.8% of all spans since 1950. Over five years, in 16%. The crash itself is common. Needing the money in the middle of it is the risk.
There is a second risk most 401k statements do not show. A fund that tracks the S&P 500 now holds a large part of its money in a handful of AI and tech names. Diversified by the number of companies is not the same as diversified by risk.
And the parts of a 401k that are meant to be safe are not always safe. Since 2015, long-dated government bonds, the classic cushion, fell further from their high than the S&P 500 did. We measured nine assets side by side in the risk chart nobody shows you. Gold fell the least of them.
What does a crash look like from the inside?
On paper, a bear market is one line on a chart. From the inside, it is months of red statements. Every one of the 11 bear markets since 1950 started at a record close, when the last fall already felt far away.
That is the pattern we see again and again in the data. Confidence is highest at the top. Fear is highest near the bottom. Most of the damage to a long-term result does not come from the crash itself. It comes from what people do in it: getting out after the fall, and coming back after the recovery.
The numbers in this article are the counterweight to that feeling. A 20% fall is not rare. It is the normal price of owning stocks for five years. Ending five years lower is the rare part.
What did getting out cost?
The natural reaction to a crash is to get out until it is over. The data shows what that cost.
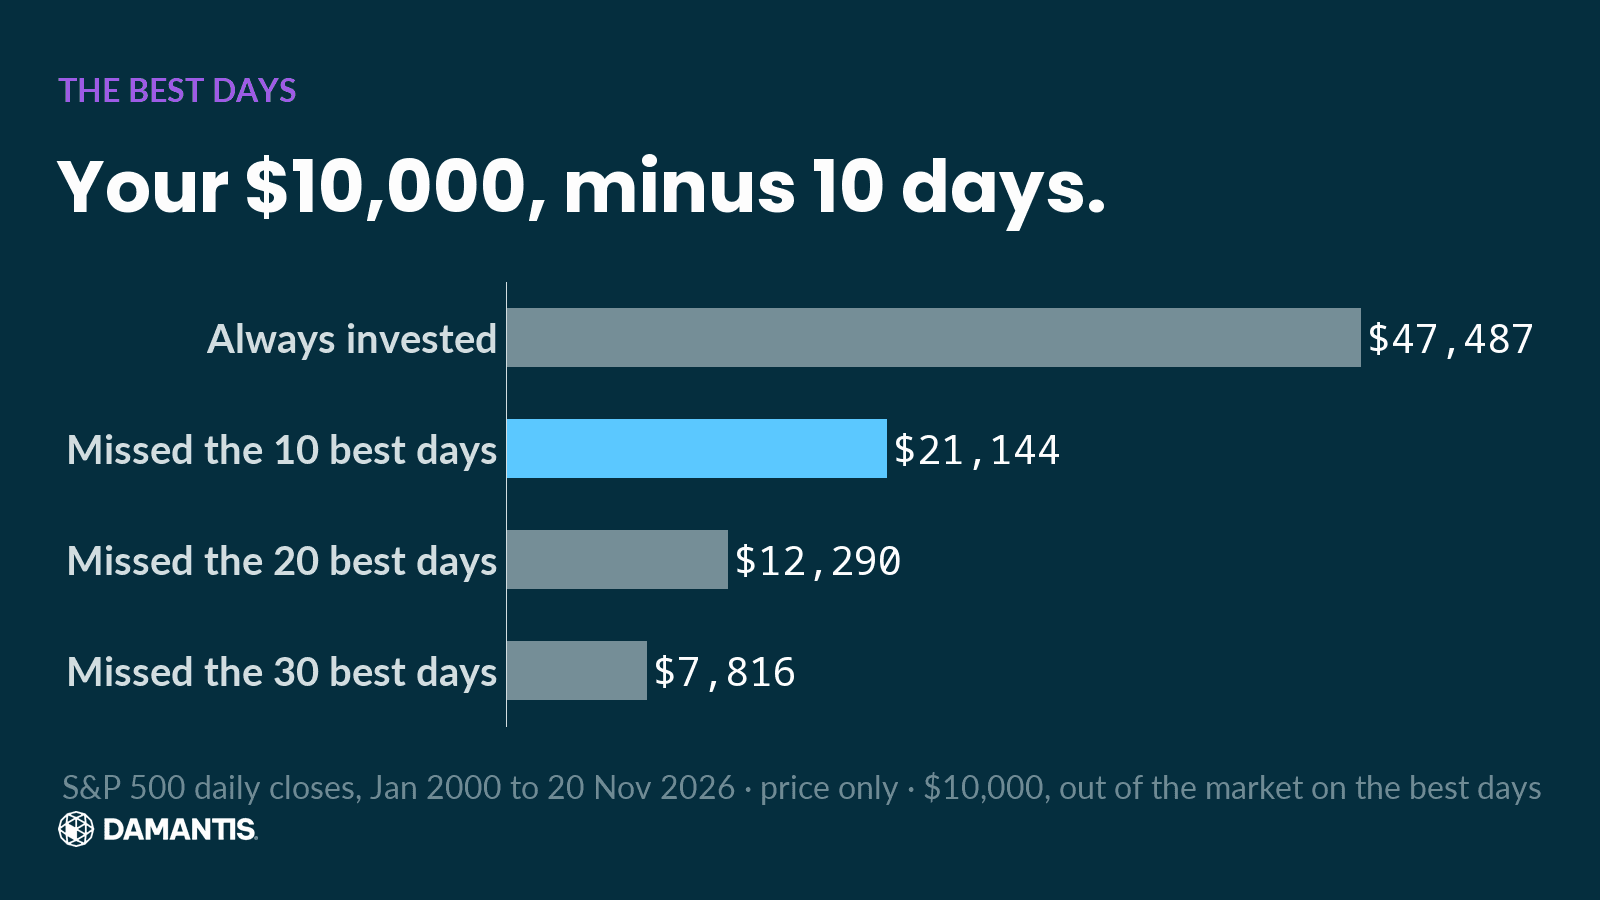
From 2000, missing only the 10 best days of the S&P 500 cut the end result by 55%. And 6 of those 10 best days came within two weeks of one of the 10 worst. The best days arrived in the middle of the panic, when getting out felt safest.
Where do we stand?
We do not know when the next 20% fall comes. History says it comes, about 7 times in 10 over any five years. We would rather decide before it what we do in it: where we step aside, where we come back, written down while the market is calm.
That is also why we track the Damantis Extremes Index, the share of all US stocks at a one-year low every trading day since 1995. It shows when the crowd is getting out, and what followed.
None of this tells anyone what to do with their own money. It is the full record, so you can check it.
Frequently asked questions
What are the odds of a 20% stock market drop in the next 5 years?
Nobody can know the next five years. Counted over every five-year span since 1950, the S&P 500 fell 20% or more from a high inside the span 69% of the time, a fall of 30% or more 41% of the time, and a fall of 50% or more 6% of the time. Prices only, overlapping spans.
How often does a bear market happen?
The S&P 500 had 11 falls of 20% or more from a closing high since 1950, about one every 7 years.
What happens to my 401k if the stock market crashes?
The stock funds in a 401k fall with the market, and the bond and cash parts move less. Since 1950, the S&P 500 ended a five-year span lower 16% of the time, a ten-year span 6.8% of the time, and a twenty-year span never.
How long does it take the stock market to recover from a crash?
Of the 7 falls of 30% or more since 1927, the fastest got back to its old high in about 6 months and the slowest took 25 years, prices only. Dividends shorten every one of them.
Are bonds safe in a stock market crash?
Not always. Since 2015, long-dated US government bonds fell further from their high than the S&P 500. The full comparison of nine assets is in the risk chart nobody shows you.
Can the S&P 500 go to zero in a crash?
It never has. Its deepest fall since 1927 was 86%, from 1929 to 1932.
How DAMANTIS looks at this
Every chart in this article was computed from market data, with its source and date on the image. No figure was typed in by hand. Once a week we send the same kind of count for the whole US market: the Damantis Extremes Index, how many US stocks sit at extremes, against a normal week and the record. One email, no daily noise. Get the weekly email
Education, not investment advice.