Ask ten people which investment is safe, and most will say government bonds. Ask which is risky, and you'll hear Bitcoin, mining stocks, maybe silver. Those answers aren't wrong. But "safe" and "risky" are labels, and labels can hide a lot. So we measured risk the way it actually hurts: how far each asset fell from a high, and how much it swung from day to day.
We used nine assets on the same trading days from 2 Jan 2015 to 12 Oct 2026: the S&P 500, the Nasdaq, small caps (IWM), long-term US Treasuries (TLT), gold, silver, copper miners (COPX), uranium miners (URA) and Bitcoin.
What is the safest investment by maximum drawdown?
The maximum drawdown is the largest drop from a previous high at any point in the period. It answers a simple question: what was the worst moment an investor had to sit through?
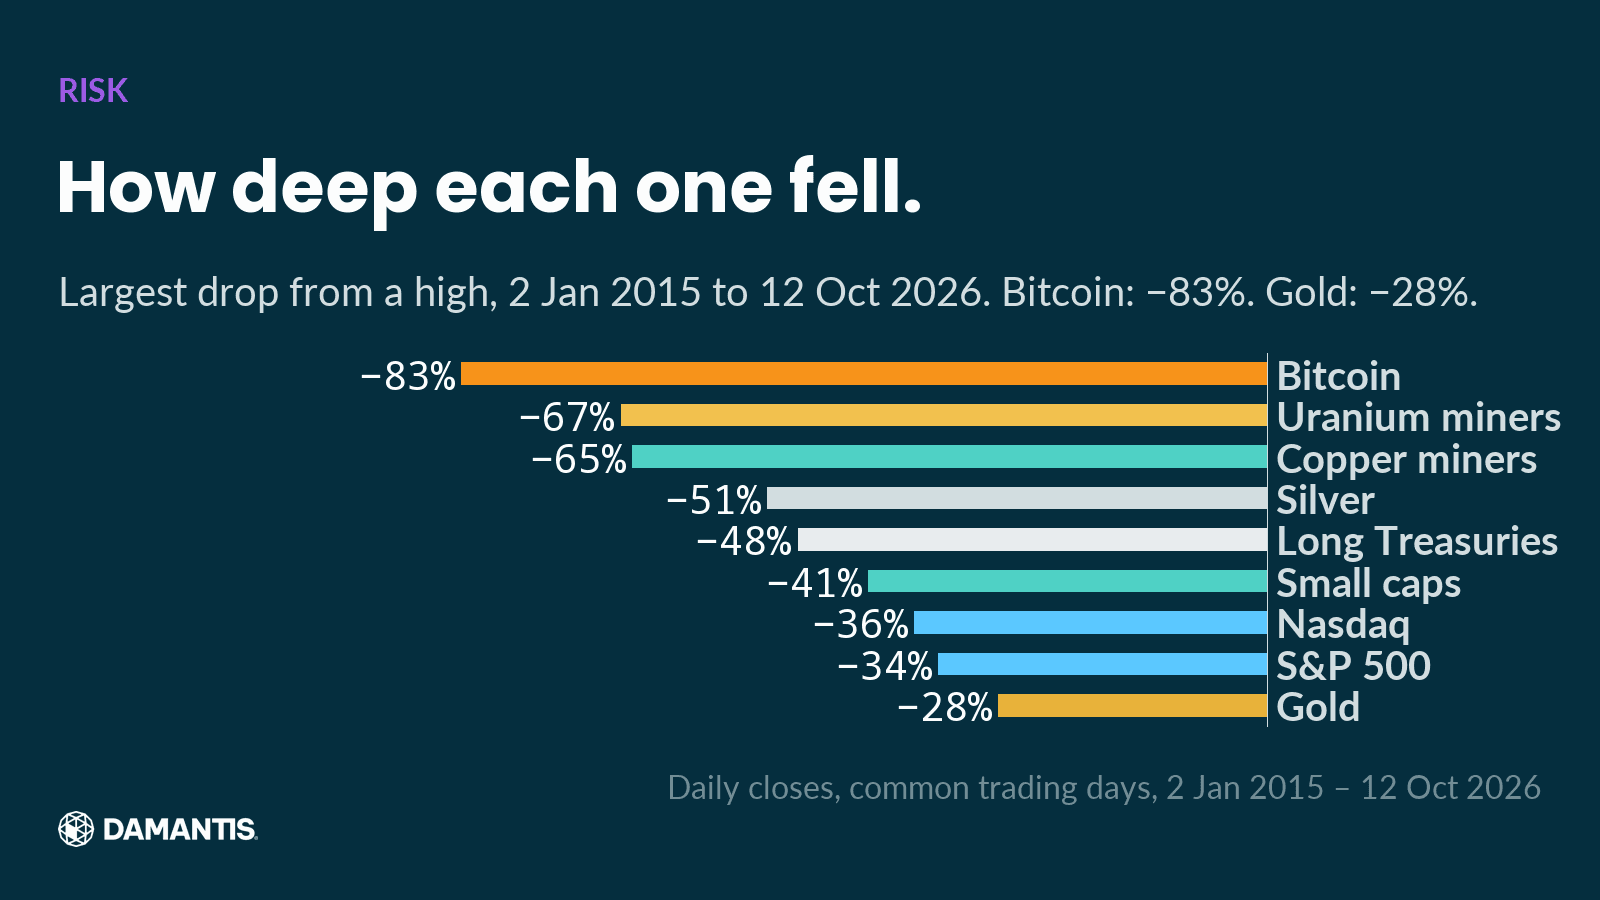
The smallest maximum fall belonged to Gold: −28%. The largest belonged to Bitcoin: −83%. That ranking surprises nobody.
The middle of the list is where the labels break down. Long-term Treasuries, the textbook safe asset, stood −48% from a high at their worst. That is a deeper fall than the S&P 500 (−34%), the Nasdaq (−36%) and small caps (−41%). Long-dated bonds lose value when interest rates rise, and when rates rose quickly after 2021, the "safe" asset fell further than the stock market.
Can bonds lose money?
Yes, and the chart shows how much. A long-term government bond pays back its face value at maturity, so an investor who holds it to the end gets the promised amount. But the price in between moves with interest rates, and a fund of long-dated bonds can fall a long way. "Safe from default" and "safe from losses" are not the same thing.
Which asset is the most volatile?
Drawdown measures the worst moment. Volatility measures the everyday ride: how much an asset moves from one day to the next, expressed as an annual rate.
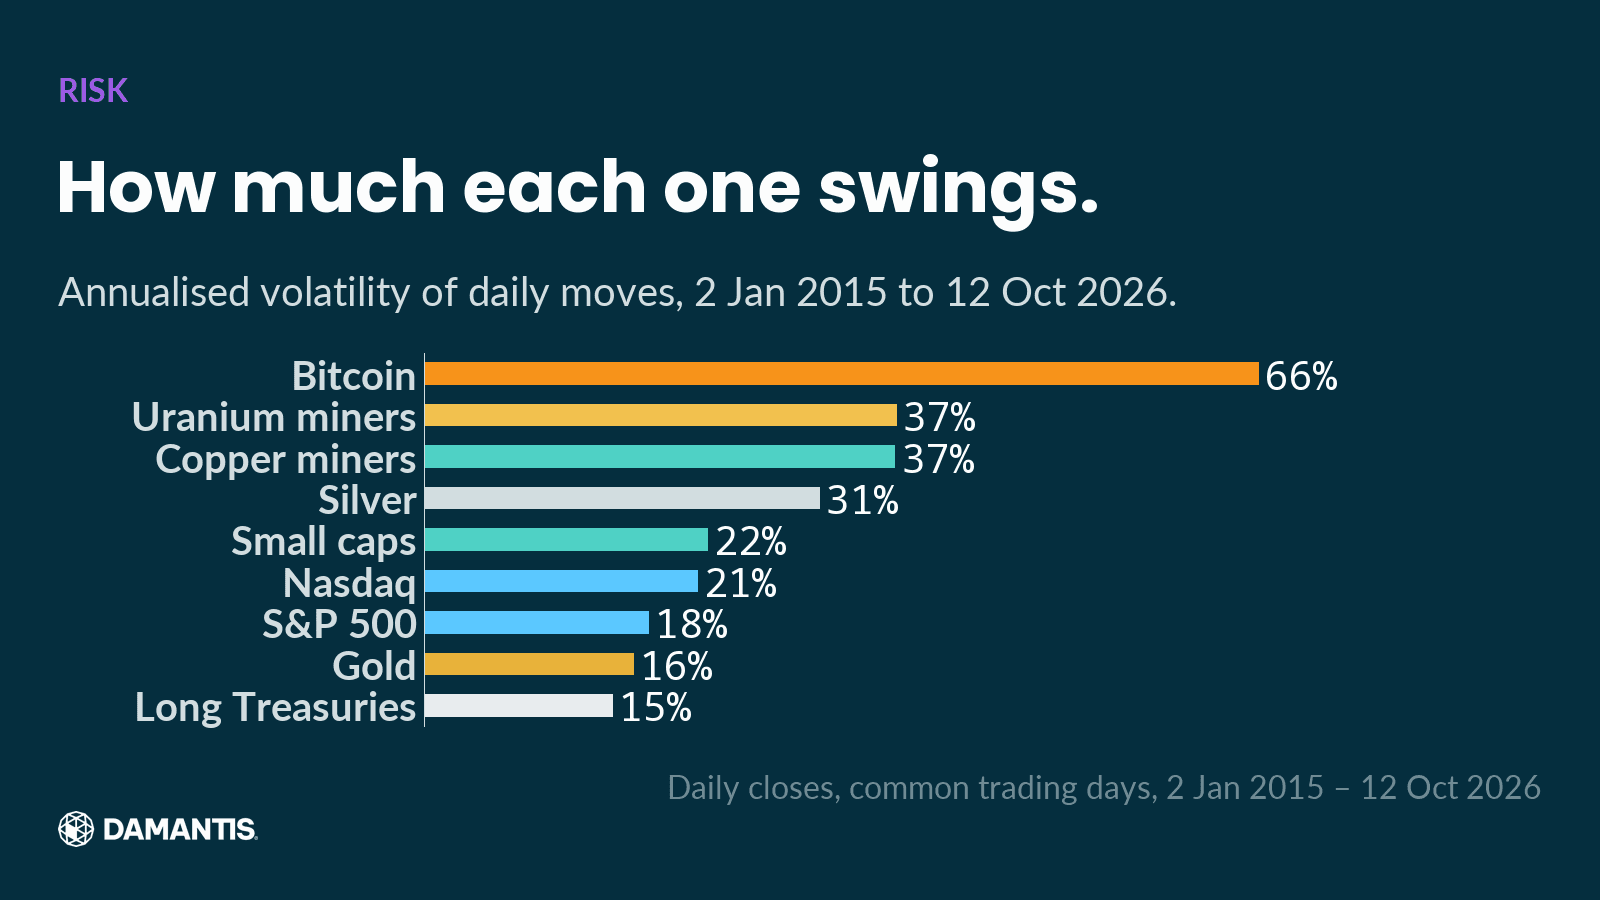
Bitcoin swung the most, with an annualised volatility of 66%. Copper miners came in at 37% and uranium miners at 37%. The least volatile was Long Treasuries, at 15%, with gold close behind at 16%.
Put the two charts together and you get the real surprise: long Treasuries had the calmest day-to-day ride of all nine, and one of the deeper falls. Low volatility made them feel safe. It didn't stop the losses from piling up over many quiet months.
Do bonds protect you when stocks crash?
That's the other half of the bond story, and here bonds did their job. We took the 8 sharpest daily falls of the S&P 500 since 30 Jul 2002 and checked what long Treasuries did on each of those days.
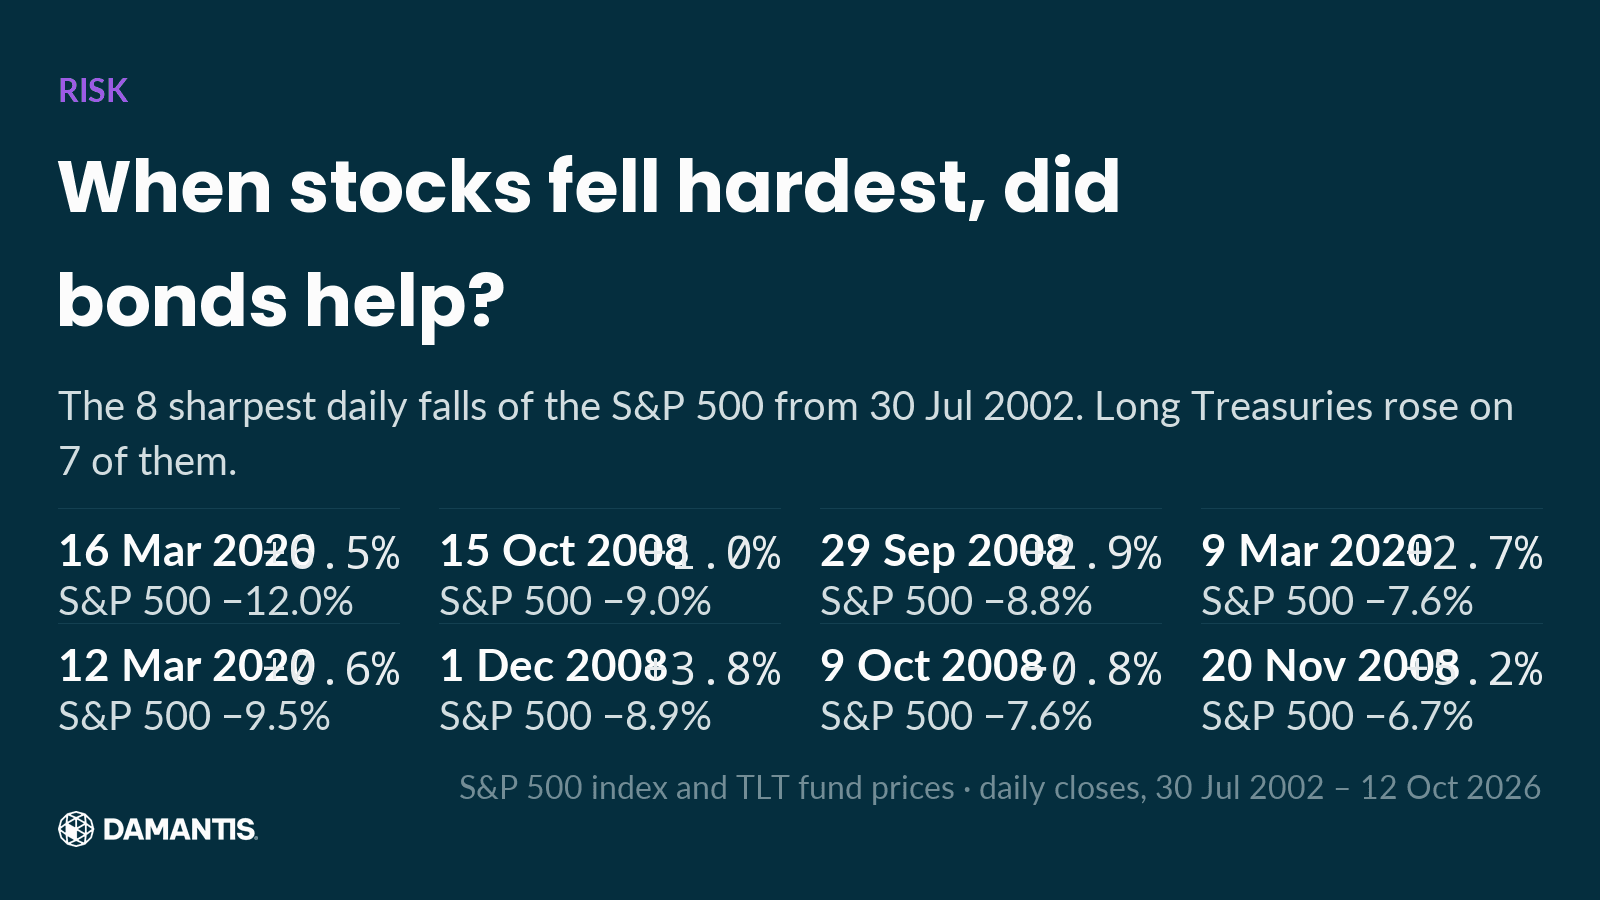
On 7 of those 8 days, long Treasuries rose while stocks fell hard. In a sudden panic, investors still run to government bonds.
So bonds protected against crashes and failed against inflation. That is exactly the pattern we found in our piece on inflation hedges: when inflation pushed interest rates up, long bonds were among the worst places to be.
Why did gold fall the least?
Gold had the shallowest maximum drawdown of the nine. That may sound like it contradicts our earlier finding that gold spends most of its time well below its records. It doesn't: that was measured over more than four decades, starting at the 1980 peak. This chart starts in 2015, a stretch in which gold mostly rose. Both are true, and together they show how much the start date shapes any statement about risk.
It is also a reminder that the period you look at decides the answer. A risk chart that starts in 2015 says little about what the same assets did in 2008 or in the 1980s. That's why we always print the dates on the chart.
Why do commodity stocks swing so much?
Copper and uranium miners had some of the deepest falls and the highest volatility of the group. Mining companies are leveraged to the price of what they dig up: their costs are largely fixed, so a small change in the metal price can mean a large change in profits, and an even larger change in the share price. That works in both directions.
How we built these charts
All nine assets are daily closing prices from a commercial market data provider, compared on the days on which all of them traded, starting on the first trading day of 2015. The funds include dividends. Gold and silver are spot prices in US dollars. Volatility is the standard deviation of daily price changes, annualised. Bitcoin's two largest daily moves in the period were confirmed against a second exchange before the chart was built.
Every chart shows its source and the last day of data on the image. The numbers in this text are not typed in by hand: they are computed from the same data as the chart next to them, and the article is only built if every number passes the same checks as our social posts. Those checks look for gaps in the data, implausible daily moves, one as-of date per chart, and stock splits that could distort a price history.
How should you measure investment risk?
No single number does it. The charts suggest three questions to ask about any asset, especially the ones with a safe reputation:
- How far has it fallen from a high, at its worst?
- How much does it move on an ordinary day?
- What does it do on the days when everything else is falling?
An asset can score well on one and badly on another. Long Treasuries are the clearest example in this period: calm day to day, protective in a panic, and still down far from their high when inflation arrived.
Frequently asked questions
What is a maximum drawdown?
The largest drop from a previous high to a later low within a period. It shows the worst loss an investor would have had to sit through.
Which asset had the smallest drawdown since 2015?
Of the nine assets we compared, Gold had the smallest maximum drawdown from 2 Jan 2015 to 12 Oct 2026, at −28%.
How much did long-term Treasuries fall?
Long-term US Treasuries (TLT) stood −48% from their high at their worst point between 2 Jan 2015 and 12 Oct 2026, a deeper fall than the S&P 500's −34%.
Do bonds rise when stocks crash?
Usually. On 7 of the 8 sharpest daily falls of the S&P 500 since 30 Jul 2002, long-term Treasuries rose.
How damantis looks at this
Every chart in this article was computed from market data, with its source and date on the image. No figure was typed in by hand. damantis applies the same discipline to its signals and model portfolio: risk first, data over narrative. See how it works at damantis.com.
Orientation, not investment advice. damantis does not recommend specific securities. Past performance is not indicative of future results. Investing involves risk of loss.