DAMANTIS Blog
The dot-com bubble took 15 years to undo. Is AI different?
Nov 16, 2026
"Is AI a bubble?" is one of the most searched market questions of the past two years. Nobody can answer it in advance, and anyone who claims to is guessing. What we can do is look at the last time a new technology lifted one corner of the market to extraordinary heights, and measure what happened afterwards. Not the story, the numbers.
The last time was 2000. The technology was the internet. It was real, it changed everything, and it still took investors in its leading stocks a very long time to get their money back.
How long did the Nasdaq take to recover from the dot-com crash?
The Nasdaq Composite set its peak close in March 2000. This chart shows, for every trading day since 1995, how far the index stood from its highest close up to that point.
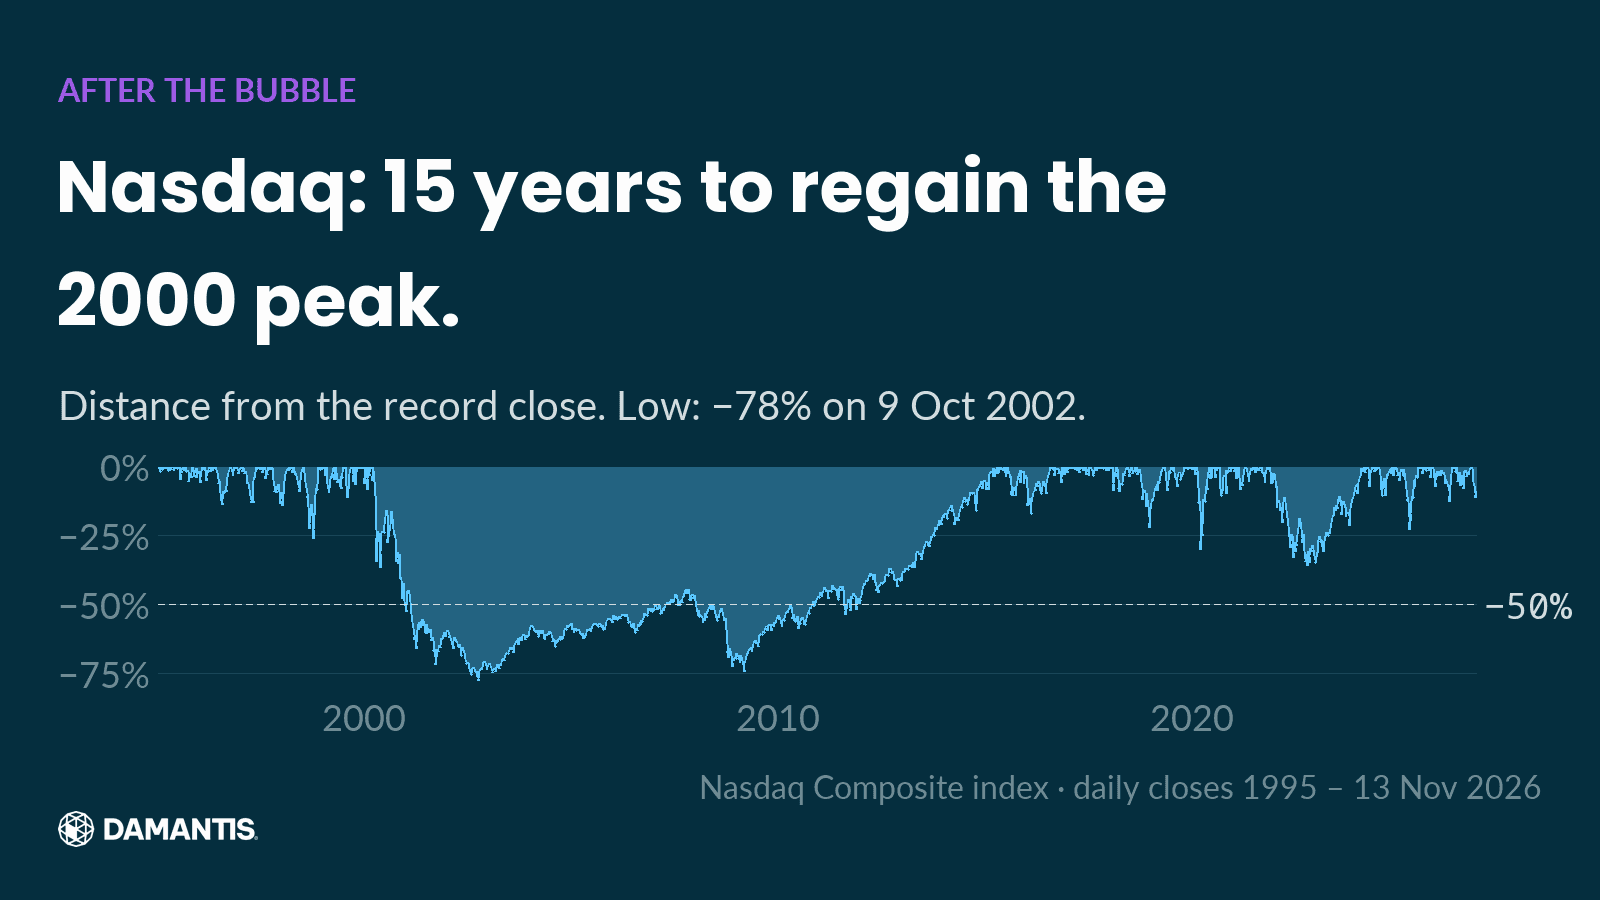
From the peak, the Nasdaq fell until 9 Oct 2002, when it stood −78% from its record. Then came the long climb back. As the chart's headline says, it took 15 years before the index closed above its 2000 peak again. On 29% of all trading days since 1995, the Nasdaq sat at least half below its previous high.
The internet did not fail. Amazon, Google and the rest went on to change the world. The index still needed a decade and a half to recover, because the prices of 2000 had run far ahead of what those companies could earn for years.
What happened to Cisco after 2000?
Cisco was the Nvidia of its time: it made the equipment the internet ran on, and for a moment in 2000 it was one of the most valuable companies in the world. Its products were real and in huge demand. Here is the same chart for Cisco, with dividends included.
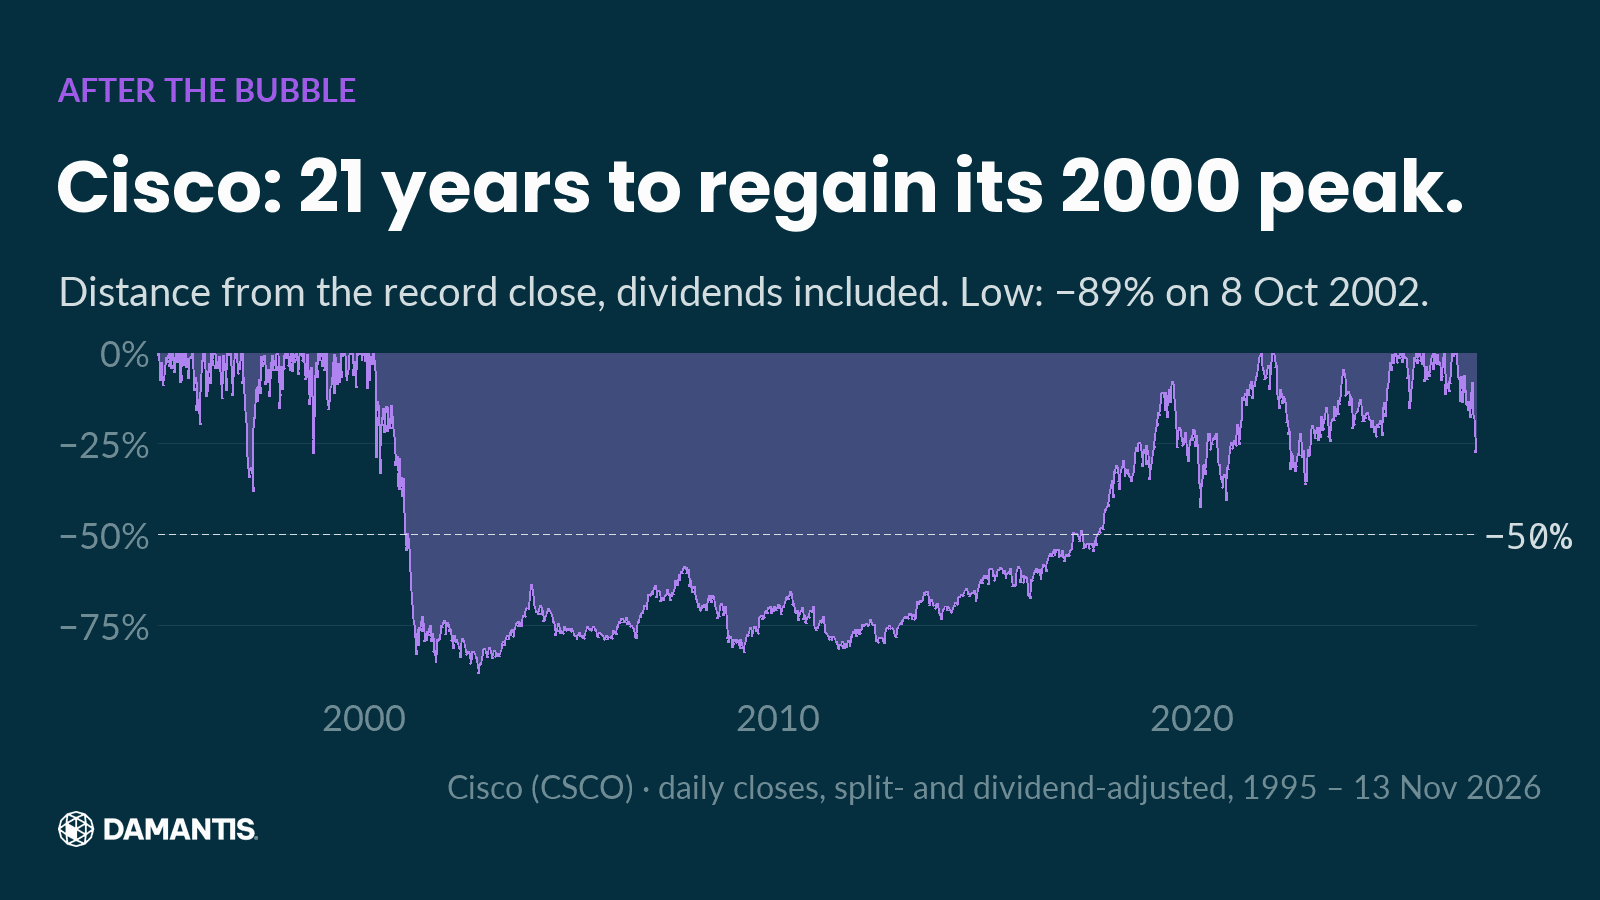
Cisco's stock fell until 8 Oct 2002, when it stood −89% from its 2000 peak. It took 21 years, dividends included, before the stock closed above that peak again. On 13 Nov 2026 it stood −26% from its record close.
The business kept growing for much of that time. That is the uncomfortable lesson of Cisco: a company can be the right company in the right industry, and its stock can still have been priced for far more than the future delivered. Being right about the technology and being right about the price are two different things.
Has Nvidia ever had a big crash?
Nvidia is this cycle's Cisco in one obvious way: it makes the equipment the new technology runs on. Its rise has been far larger than most investors expected. What gets less attention is that the ride has already included one very deep fall.
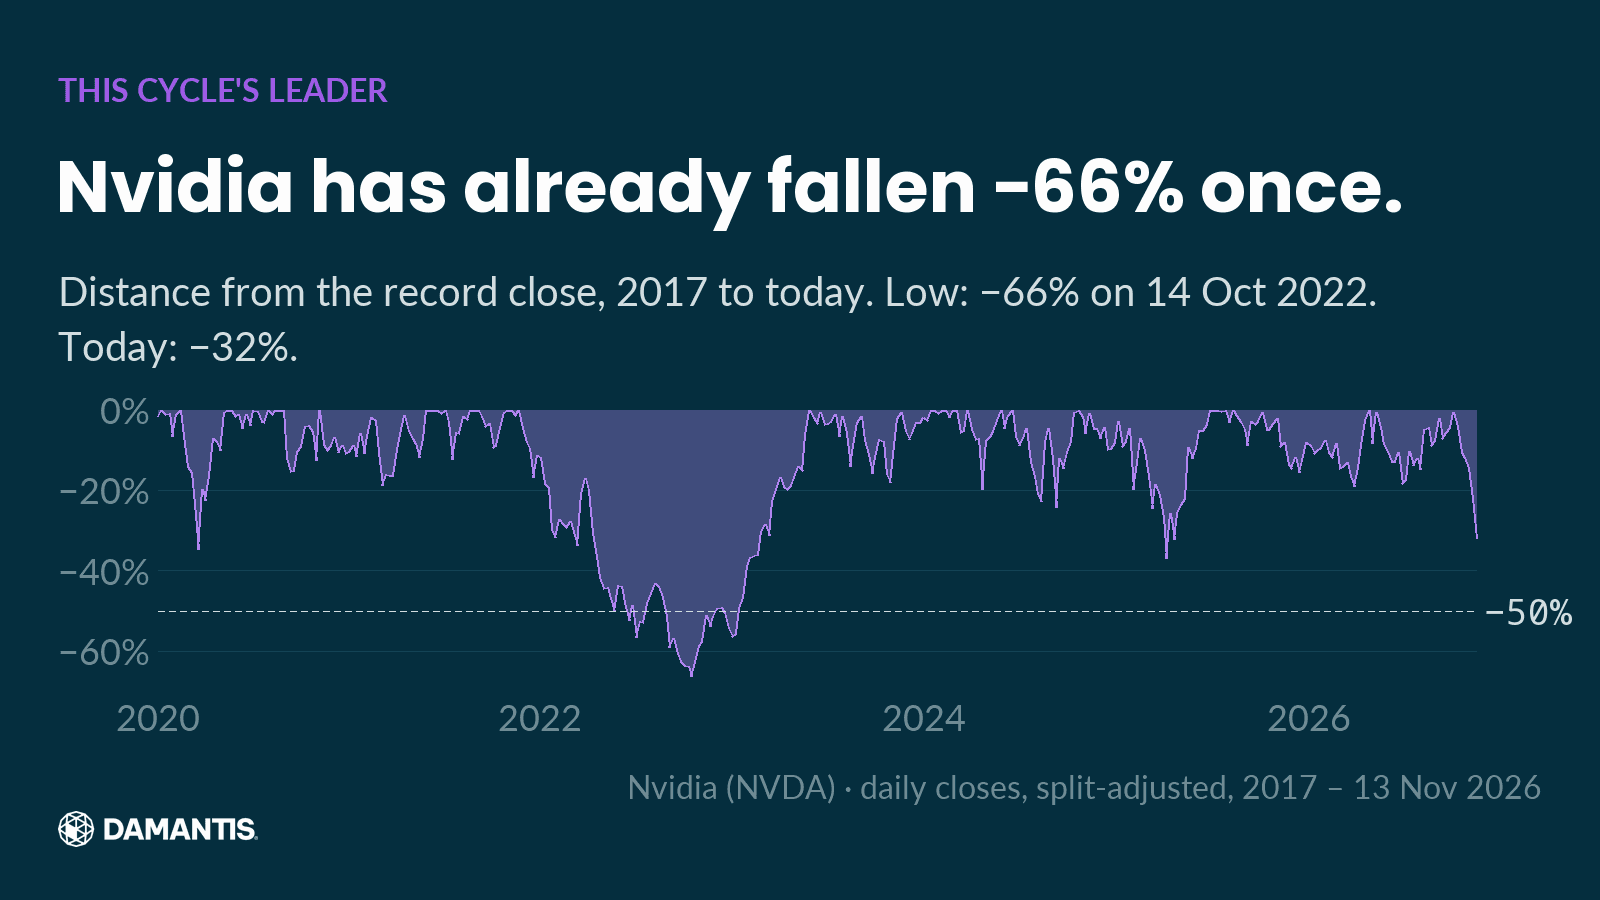
From 2017 to today, Nvidia's deepest fall from a high came on 14 Oct 2022, when the stock stood −66% from its record. On 13 Nov 2026 it stood −32% from its record close.
That fall came only weeks before ChatGPT launched and started the run that followed. Anyone who held Nvidia through 2022 saw two thirds of the value disappear before seeing it multiply. Leaders in a new technology tend to move in both directions far more than the broad market, and this one is no exception.
Is AI a bubble like the dot-com era?
The charts can't tell you whether today's prices are too high. They can tell you three things the dot-com era made very clear.
First, a real technology and an expensive stock price can exist at the same time. The internet was real in 2000. So were Cisco's sales.
Second, the cost of entering at the top is measured in years, not percentages. A fall of three quarters is painful. Waiting fifteen or twenty years to get back to even is what actually changes people's lives.
Third, leadership doesn't protect a stock. The Nasdaq's and Cisco's falls happened to the market's favorites, the companies everyone agreed would win.
We looked at how far the AI-related metals have moved since ChatGPT in Nvidia since ChatGPT: what did the AI metals do?. Together with these charts, the pattern is consistent: the closer an asset is to the center of the story, the bigger its gains and the deeper its falls.
How we built these charts
The Nasdaq Composite is the index level at each day's close. Cisco and Nvidia are daily closing prices adjusted for stock splits; Cisco's chart also includes dividends, which makes its recovery look faster than the price alone would. Each chart shows the distance from the highest close up to that day, so zero means a new record. The recovery times in the headlines are checked against the same data: the first close above the 2000 peak.
Every chart shows its source and the last day of data on the image. The numbers in this text are not typed in by hand: they are computed from the same data as the chart next to them, and the article is only built if every number passes the same checks as our social posts. Those checks look for gaps in the data, implausible daily moves, one as-of date per chart, and stock splits that could distort a price history.
Frequently asked questions
How much did the Nasdaq fall after the dot-com bubble?
From its March 2000 peak to 9 Oct 2002, the Nasdaq Composite fell to −78% from its record close, based on daily closing prices.
How long did it take the Nasdaq to recover from 2000?
About 15 years. The Nasdaq Composite first closed above its 2000 peak again in 2015, based on daily closing prices.
What happened to Cisco stock after 2000?
Cisco fell to −89% from its 2000 peak by 8 Oct 2002. Including dividends, it needed 21 years to close above that peak again.
Has Nvidia stock crashed before?
Yes. On 14 Oct 2022, Nvidia stood −66% from its record close, its deepest fall since 2017.
How damantis looks at this
Every chart in this article was computed from market data, with its source and date on the image. No figure was typed in by hand. damantis applies the same discipline to its signals and model portfolio: risk first, data over narrative. See how it works at damantis.com.
Education, not investment advice.