DAMANTIS Blog
The Nasdaq is 19.8% below its record. We think the top is in for years, not months.
Nov 22, 2026
Almost. On 20 Nov 2026 the Nasdaq-100 closed at 25,028.98, 19.8% below its record of 31,224.47 from 6 Oct 2026. A bear market starts, by the usual convention, at 20%. Since 1985 the index first closed 20% below its record 8 times. 7 of those 8 times it was back at a new record within about two years. Once, in 2000, it took 15.6 years. We think this one is the 2000 kind.
On Friday the Nasdaq-100 lost 5.6% in one day. Since the record it has had 2 days with a fall of 5% or more. Anyone with a broad US stock fund owns these companies too, because the largest Nasdaq companies are also the largest companies in the S&P 500. Many of them are asking the same question this weekend.
So here is the full count, every case since 1985, and then our stand.
Is the Nasdaq in a bear market?
Not by the strict line, not yet. The record close was 31,224.47 on 6 Oct 2026. A close 20% below it would be 24,979.58. Friday's close was 25,028.98. The gap is about 0.2%, less than a quiet day's move.
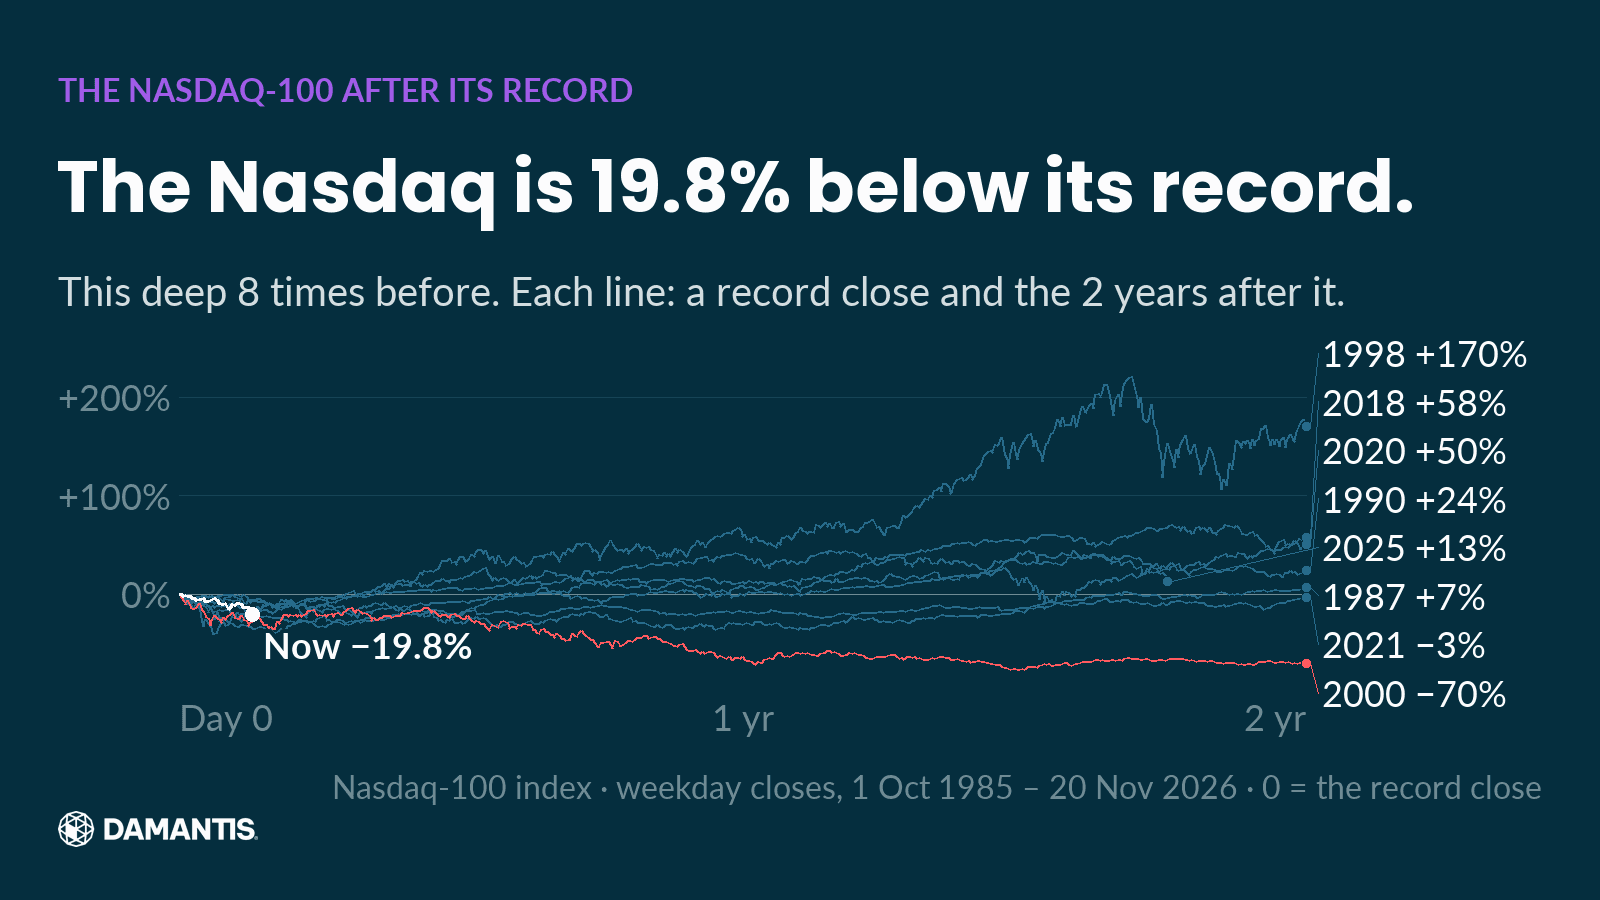
The chart puts every earlier record that was followed by a fall this deep on one line each, and follows it for two years. Zero is the record close. The line in white is today. The Nasdaq-100 got here in 45 days, 33 trading days. That is not unusual: in the earlier cases the first close 20% below the record came 14 to 115 days after the record.
Of the 7 cases with two full years behind them, the index stood higher two years after the record in 5. The 2025 case has not reached two years yet; its line ends at the last close. The exception that matters is 2000, two years in at −70%.
What is the difference between a correction, a bear market and a crash?
These words are conventions, not laws. Most market reporters use them like this:
- A correction is a fall of 10% or more from the last record close.
- A bear market is a fall of 20% or more from the last record close.
- A crash has no fixed number. People use it for a very fast fall, like 19 October 1987, or for a very deep one, like 2000 to 2002.
The 20% line is a round number. Nothing in the market changes when an index crosses it. What it does give us is a fair, simple way to count: the same rule, applied to every case, without picking the ones that fit a story.
How long did Nasdaq bear markets last?
Here is every time since 1985 that the Nasdaq-100 first closed 20% below its record, and how many years it took from that record to the next one.
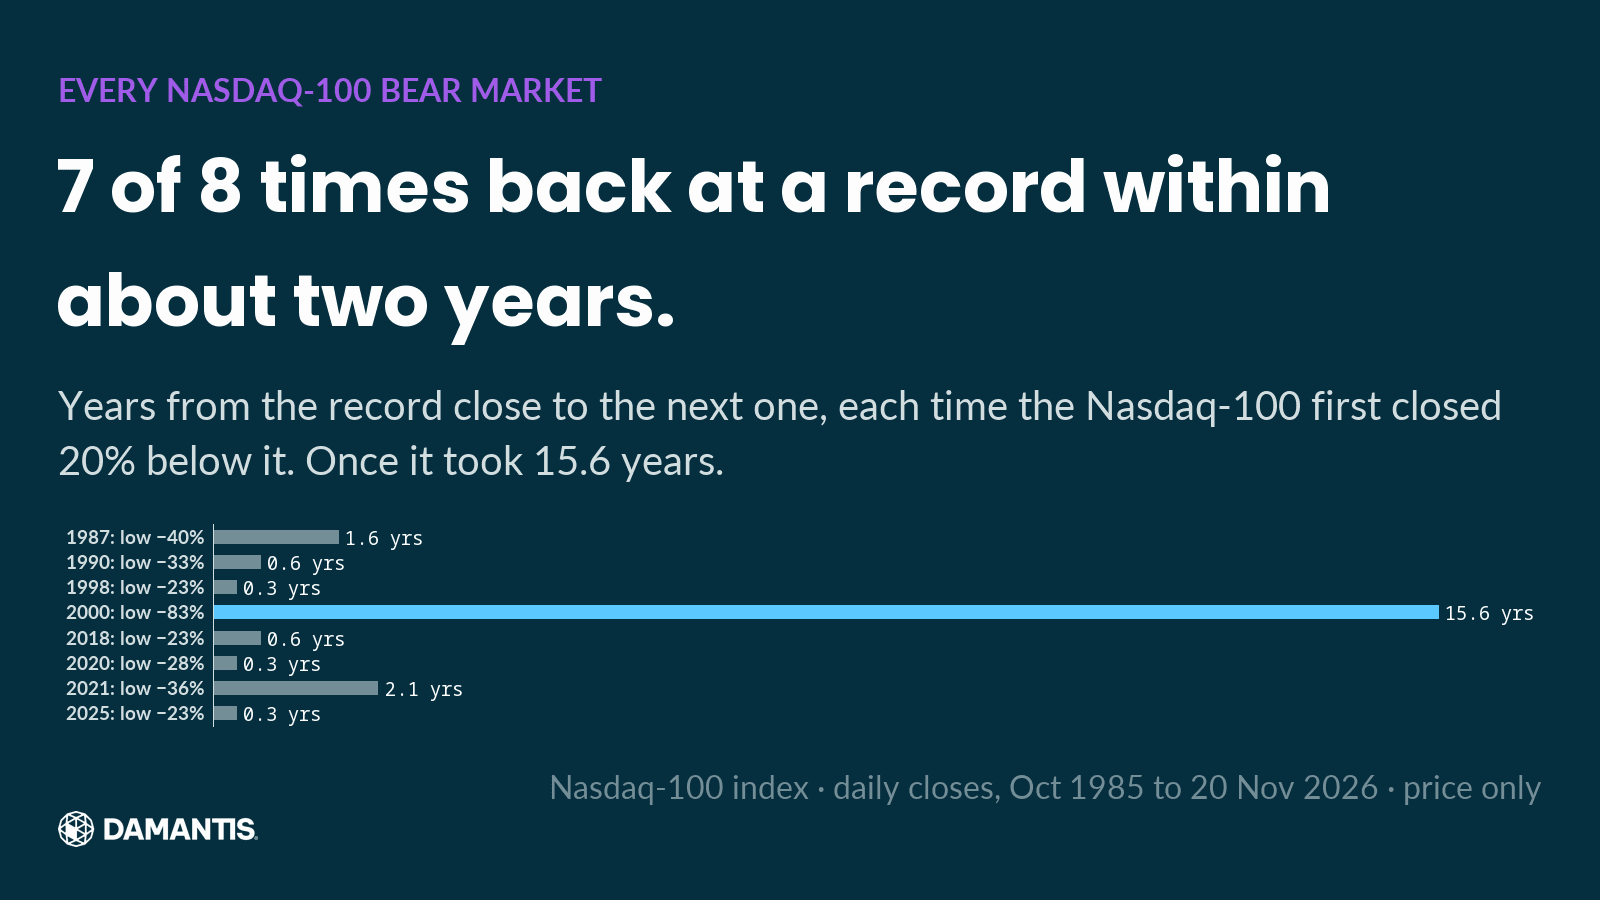
- 1987: the record was on 5 Oct 1987. The index fell as far as −39.9% and was back at a record 1.6 years after the old one.
- 1990: low −32.9%, back after 0.6 years.
- 1998: low −23.0%, back after 0.3 years.
- 2000: low −82.9%, back after 15.6 years, in Nov 2015.
- 2018: low −23.0%, back after 0.6 years.
- 2020: low −28.0%, back after 0.3 years.
- 2021: low −35.6%, back after 2.1 years.
- 2025: low −22.9%, back after 0.3 years.
Seven of the eight look alike. A sharp fall, a low somewhere between −23% and −40%, and a new record within about two years. The median case took 0.6 years.
Then there is 2000. A fall of 83%. Someone who held the index from the March 2000 record waited until Nov 2015 to see that level again. For a 55-year-old in 2000, that was the rest of their working life.
And one year after the first 20% day? Higher in 6 of 8 cases.
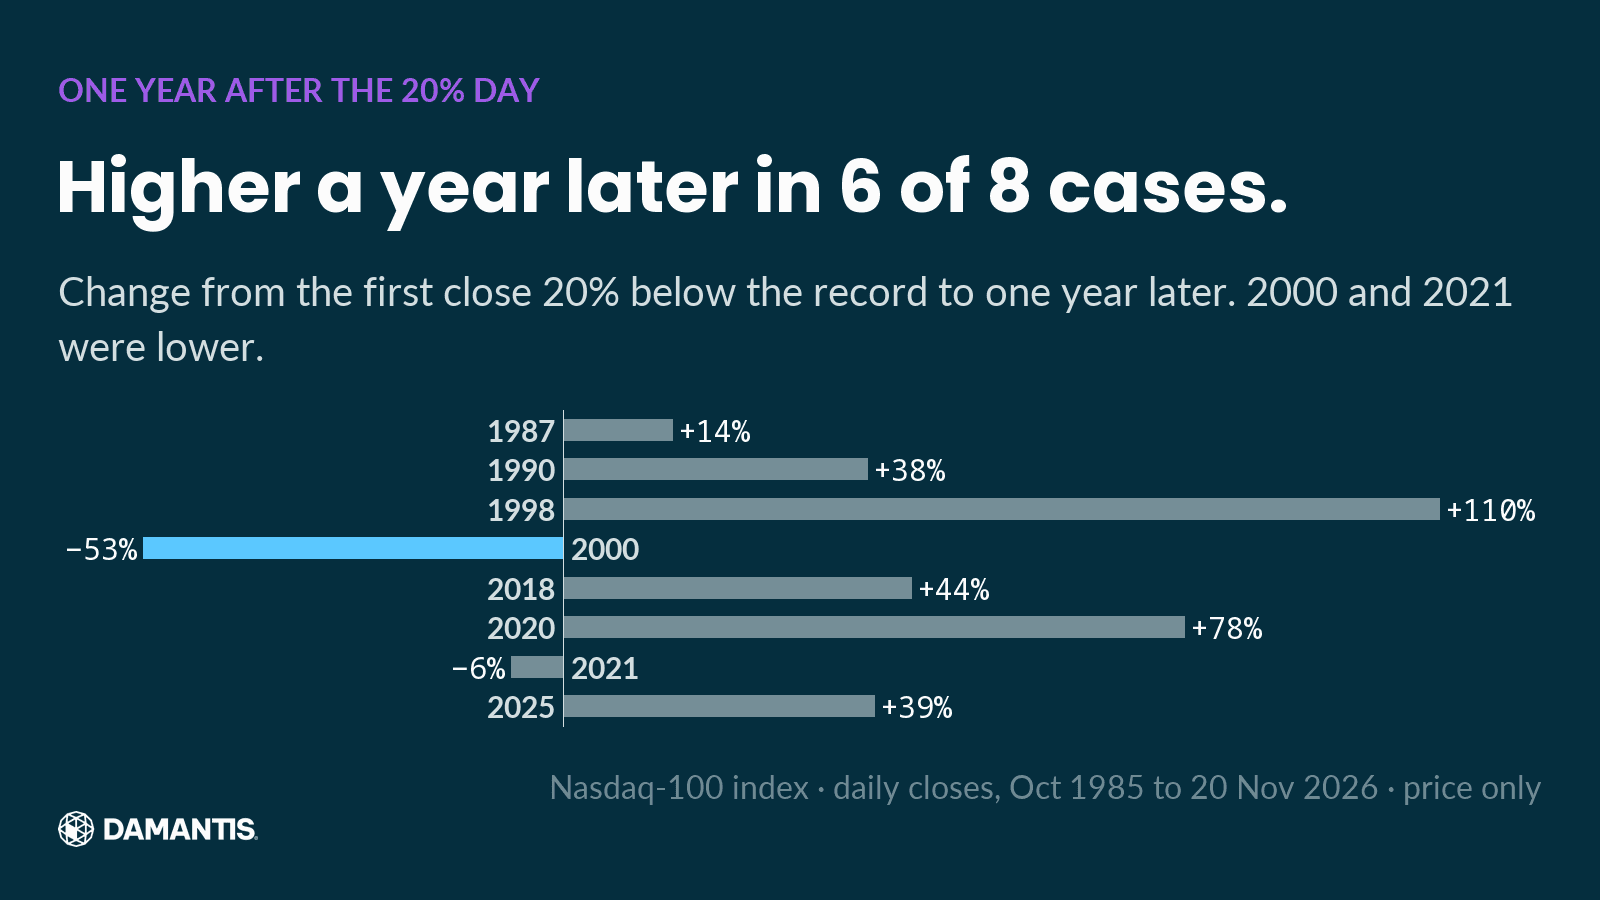
That is what history says, and it says it clearly: most Nasdaq bear markets were over fast. A call that this one is the long kind goes against 7 of 8 cases. We make that call anyway, with the count in plain sight. We think the 2000 case is the one that fits.
Why do we think this one is 2000?
On 8 November we wrote it down in plain words: we think AI is a bubble. Not the technology. The price. On 16 November we showed what happened the last time a new technology lifted the Nasdaq this high. Friday's close does not change that stand. It is the stand playing out.
Two reasons, and one honest caveat.
First, the money loop. Chip makers and cloud companies take stakes in AI start-ups, and the start-ups spend that money on the same chips and cloud. Big tech funds data centres partly through private credit and other lenders outside normal bank rules. When the seller pays for part of the demand, the demand is weaker than it looks. In 2000 the same pattern had a name, vendor financing: equipment makers lent money to the companies that bought their equipment.
Second, how few companies carry the index. The Nasdaq-100 holds 100 companies, but a handful of AI giants carry a large part of it. When the index falls, it is mostly those few names falling. An index this dependent on one story recovers when that story recovers. In 2000 the story was the internet, and the leaders needed far longer than the index's usual two years.
The caveat. The price data alone does not point to 2000. In the three years before its March 2000 record, the Nasdaq-100 rose 475%. In the three years before the record of 6 Oct 2026, it rose 109%. That is closer to 2021 (149%) and 2018 (77%) than to 2000. The speed of the fall is ordinary too: 33 trading days after its record, the index stood −19.8% from it. At the same point after their records, 2000 stood at −27.6%, 2025 at −21.4% and 1998 at −17.5%. Our stand rests on what sits inside the index and how it was paid for, not on the chart. That is what makes it a stand and not a count.
What we are watching
Neutral facts we will report, whichever way they go:
- The 20% line. A close at or below 24,979.58 is a bear market by the convention.
- The old record. 31,224.47. In the seven quick cases, the index was back above its record within 2.1 years.
- The depth. In seven of the eight cases the deepest close was no worse than −40%. Only 2000 went further.
- One year from the first 20% close. Higher in 6 of 8 earlier cases.
We will report each one as it happens.
None of this tells anyone what to do with their own money. It is our view, with every case next to it, so you can check it. Screenshot this.
Frequently asked questions
Is the Nasdaq in a bear market right now?
Not by the strict 20% line. On 20 Nov 2026 the Nasdaq-100 closed 19.8% below its record close of 6 Oct 2026. A close at or below 24,979.58 would be 20% below it.
How many Nasdaq bear markets were there since 1985?
The Nasdaq-100 first closed 20% below a record 8 times since 1985: after the records of 1987, 1990, 1998, 2000, 2018, 2020, 2021 and 2025, based on daily closes.
How long do Nasdaq bear markets last?
From the record to the next record, the median case took 0.6 years. 7 of 8 were back at a record within about two years. The one after March 2000 took 15.6 years, until Nov 2015.
How far did the Nasdaq fall after 2000?
The Nasdaq-100 fell 82.9% from its March 2000 record close to its low, based on daily closes, prices only.
Was the Nasdaq higher one year after it first fell 20%?
In 6 of 8 cases since 1985. The two exceptions were 2000 (−53%) and 2021 (−6%).
How DAMANTIS looks at this
Every chart in this article was computed from market data, with its source and date on the image. No figure was typed in by hand. Once a week we send the same kind of count for the whole US market: the Damantis Extremes Index, how many US stocks sit at extremes, against a normal week and the record. One email, no daily noise. Get the weekly email
Education, not investment advice.